
Manufacturing and Analytical Characterization - Chemical
Category: Poster Abstract

Patrick J. Marroum, PhD
Distinguished Research Fellow
AbbVie, Inc.
North Chicago, Illinois, United States
 photo")
Frank Theil, PhD (he/him/his)
Principal Research Scientist
Abbvie
Ludwigshafen, Rheinland-Pfalz, Germany
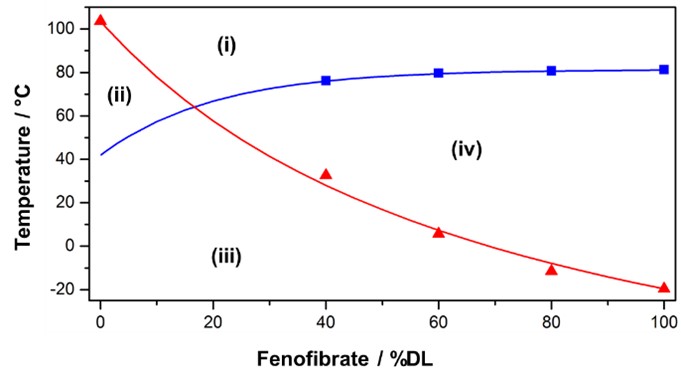 Figure 1: Exemplary phase diagram of a polymer-fenofibrate system.[9] The solubility temperature at different compositions is depicted in blue. The measured Tg values of different compositions are depicted in red. The symbols reflect measured data and the curves show modeling results. Different regions can be identified in the phase diagram: (i) thermodynamically stable melt, (ii) thermodynamically stable glass, (iii) kinetically stable glass and (iv) the undercooled or unstable melt, respectively.
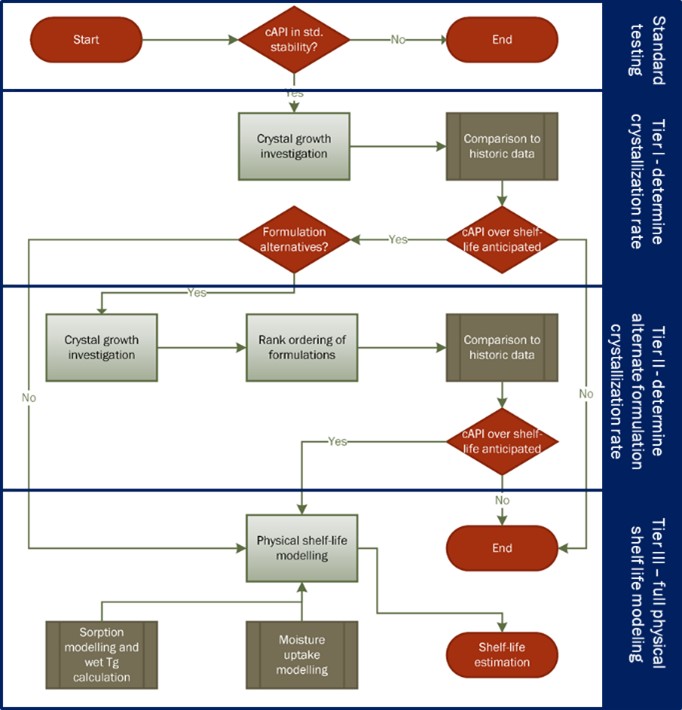 Figure 2: Workflow of the physical shelf life modelling risk assessment strategy for crystallization in ASD formulations. An investigation of the physical stability is indicated if API crystallization is observed in the standard open dish stability investigation at 40 °C / 75% RH within two weeks. In a Tier I investigation, the rate of crystallization in the ASD is determined. If crystallization is sufficiently fast to indicate a shelf life risk, the crystal growth rate in alternate formulations is determined in a Tier II investigation. If no sufficiently stable formulation can be used, a Tier III investigation is indicated and the crystal growth of the DP in the primary packaging container is approximated.
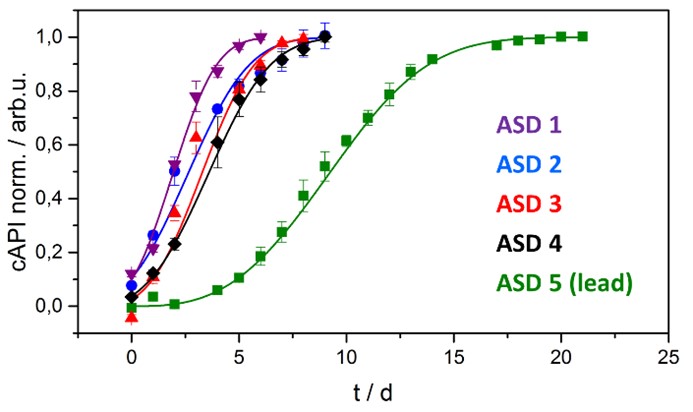 Figure 3: Crystal growth in five different ASD formulation candidates of an AbbVie internal compound. The crystal growth was recorded in samples stored at 30 °C / 75 %RH (open dish) using TRS. The fraction of crystallized API normalized to total API is shown in dependence of time.