
Formulation and Delivery - Chemical
Category: Late Breaking Poster Abstract
Muskan Badola, B.S. (she/her/hers)
University of Minnesota
Minneapolis, Minnesota, United States
Muskan Badola, B.S. (she/her/hers)
University of Minnesota
Minneapolis, Minnesota, United States
 photo")
Lushan Wang, M.S. (she/her/hers)
PhD Candidate
University of Minnesota
Minneapolis, Minnesota, United States
 photo")
Zengtao Wang, B.S. (he/him/his)
PhD Candidate
University of Minnesota
Minneapolis, Minnesota, United States
Karunya K. Kandimalla, Ph.D.
University of Minnesota
Minneapolis, Minnesota, United States
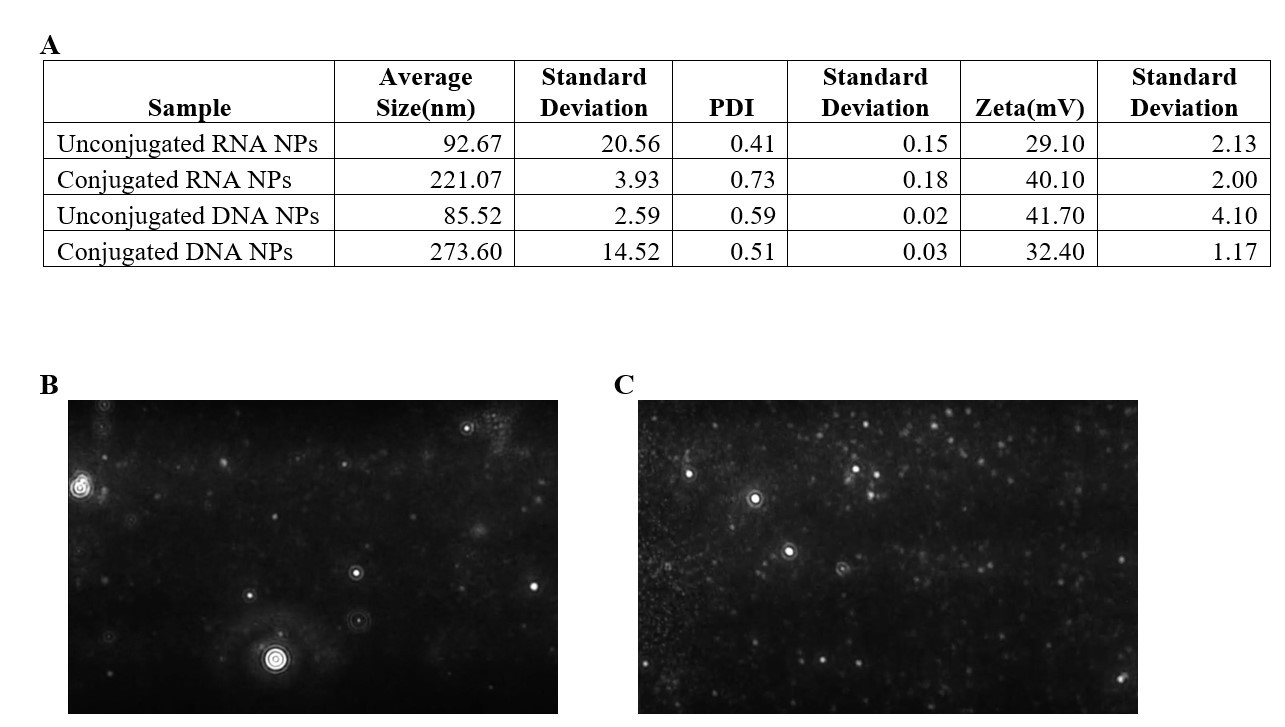 Figure 1: A Particle size, PDI and Zeta potential measured by Zetasizer for unconjugated and conjugated nanoparticles.
 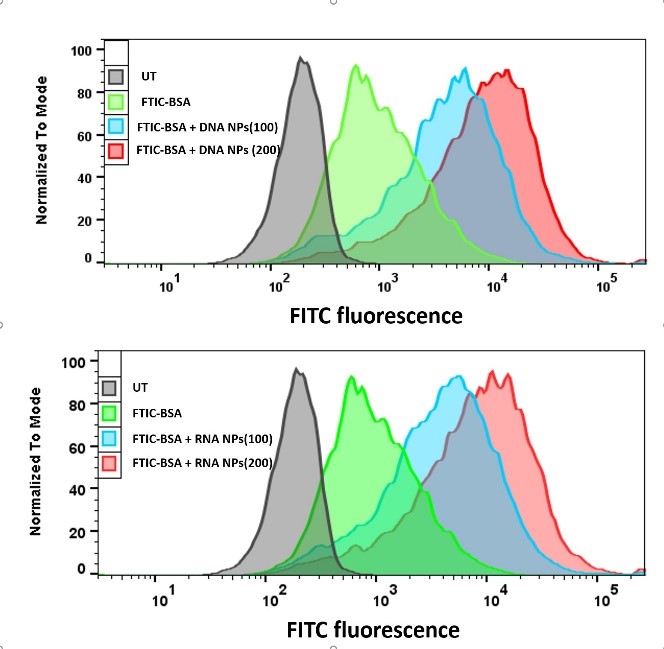 Figure 2: Uptake in hCMEC/D3 cells analyzed by Flow Cytometry. For both the graphs (from left) Grey- Untreated cells, Green- Cells treated with FITC-BSA, Blue- Cells treated with 100 microliters of FITC -BSA conjugated DNA nanoparticles(top) and RNA nanoparticles(bottom), Red- Cells treated with 200 microliters of FITC -BSA conjugated DNA nanoparticles (top) and RNA nanoparticles (bottom).
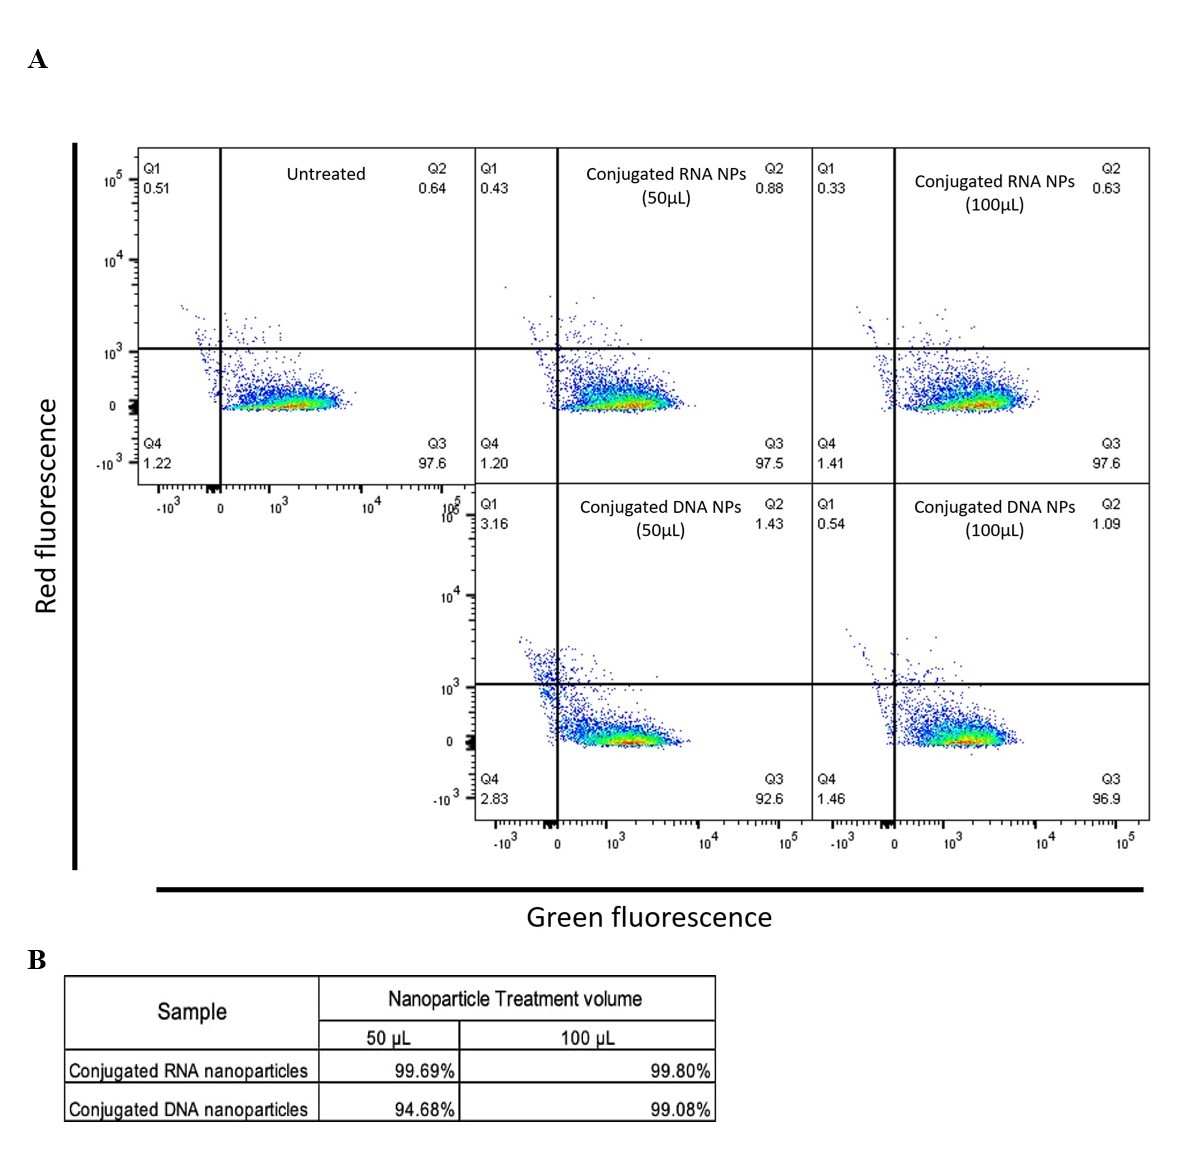 Figure 3: Live/Dead Cell assay A – Live/Dead assay in hCMEC/D3 cells analyzed by Flow Cytometry, cells were treated with 50 and 100 microliters of conjugated RNA nanoparticles and conjugated DNA nanoparticles.