
Formulation and Delivery - Chemical
Category: Poster Abstract
 photo")
Suraj Fanse, MS (he/him/his)
PhD Graduate Student
University of Connecticut
Storrs Mansfield, Connecticut, United States
Suraj Fanse, MS (he/him/his)
PhD Graduate Student
University of Connecticut
Storrs Mansfield, Connecticut, United States
Kellen Maurus, BS (he/him/his)
University of Connecticut
Storrs, Connecticut, United States
Saurabh Bhorkade, MS (he/him/his)
University of Connecticut
Storrs, Connecticut, United States
 photo")
Diane J. Burgess, Ph.D. (she/her/hers)
Distinguished Professor
University of Connecticut
Storrs, Connecticut, United States
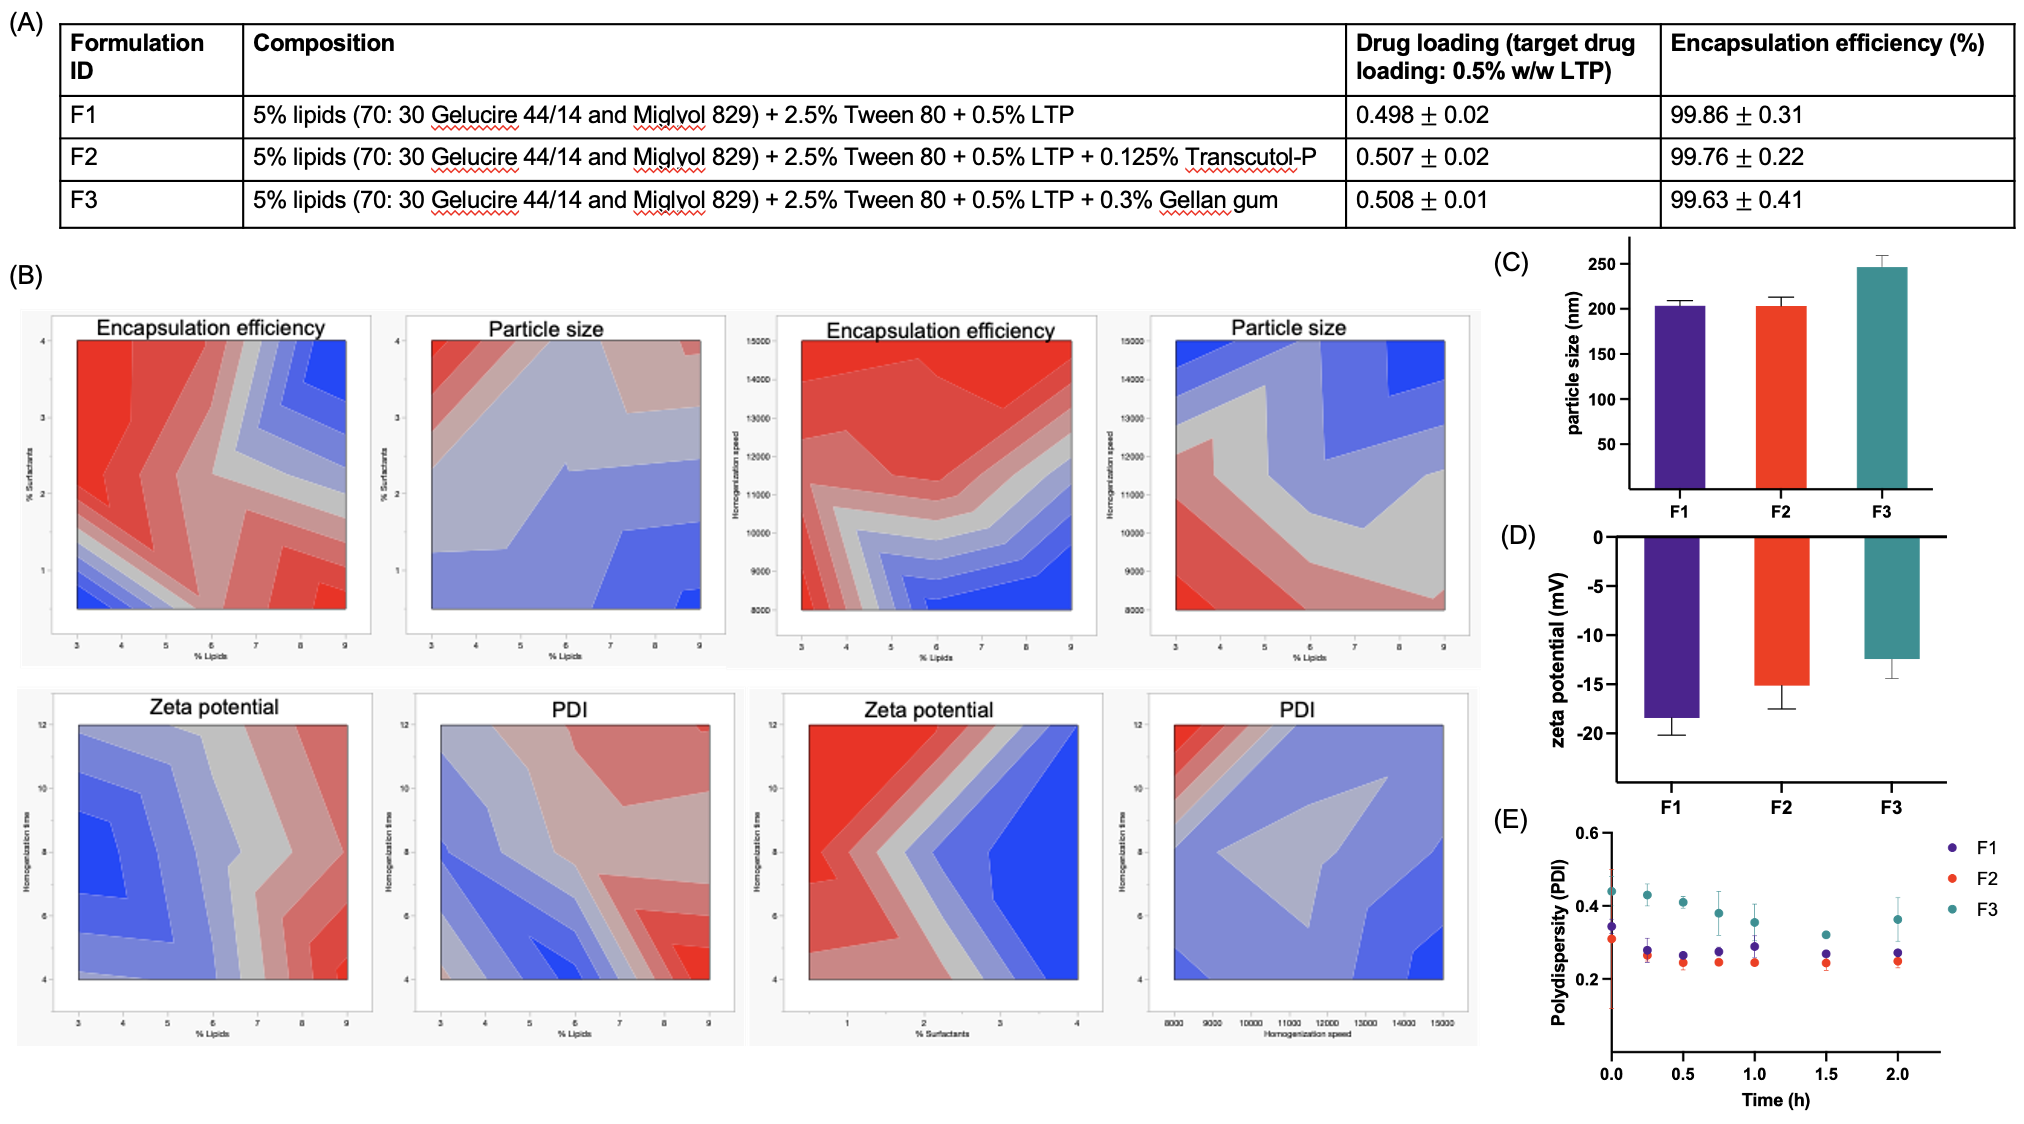 Fig. 1. A) Composition of different NLC formulations, their drug loading and encapsulation efficiency (mean±SD, n=3); B) contour plots for interactions between different dependent and independent, formulation and processing variables; C) hydrodynamic particle size (nm) of NLC formulations (mean±SD, n=3); D) zeta potential (mV) of NLC formulations (mean±SD, n=3); E) polydispersity index (PDI) of various NLC formulations (mean±SD, n=3).
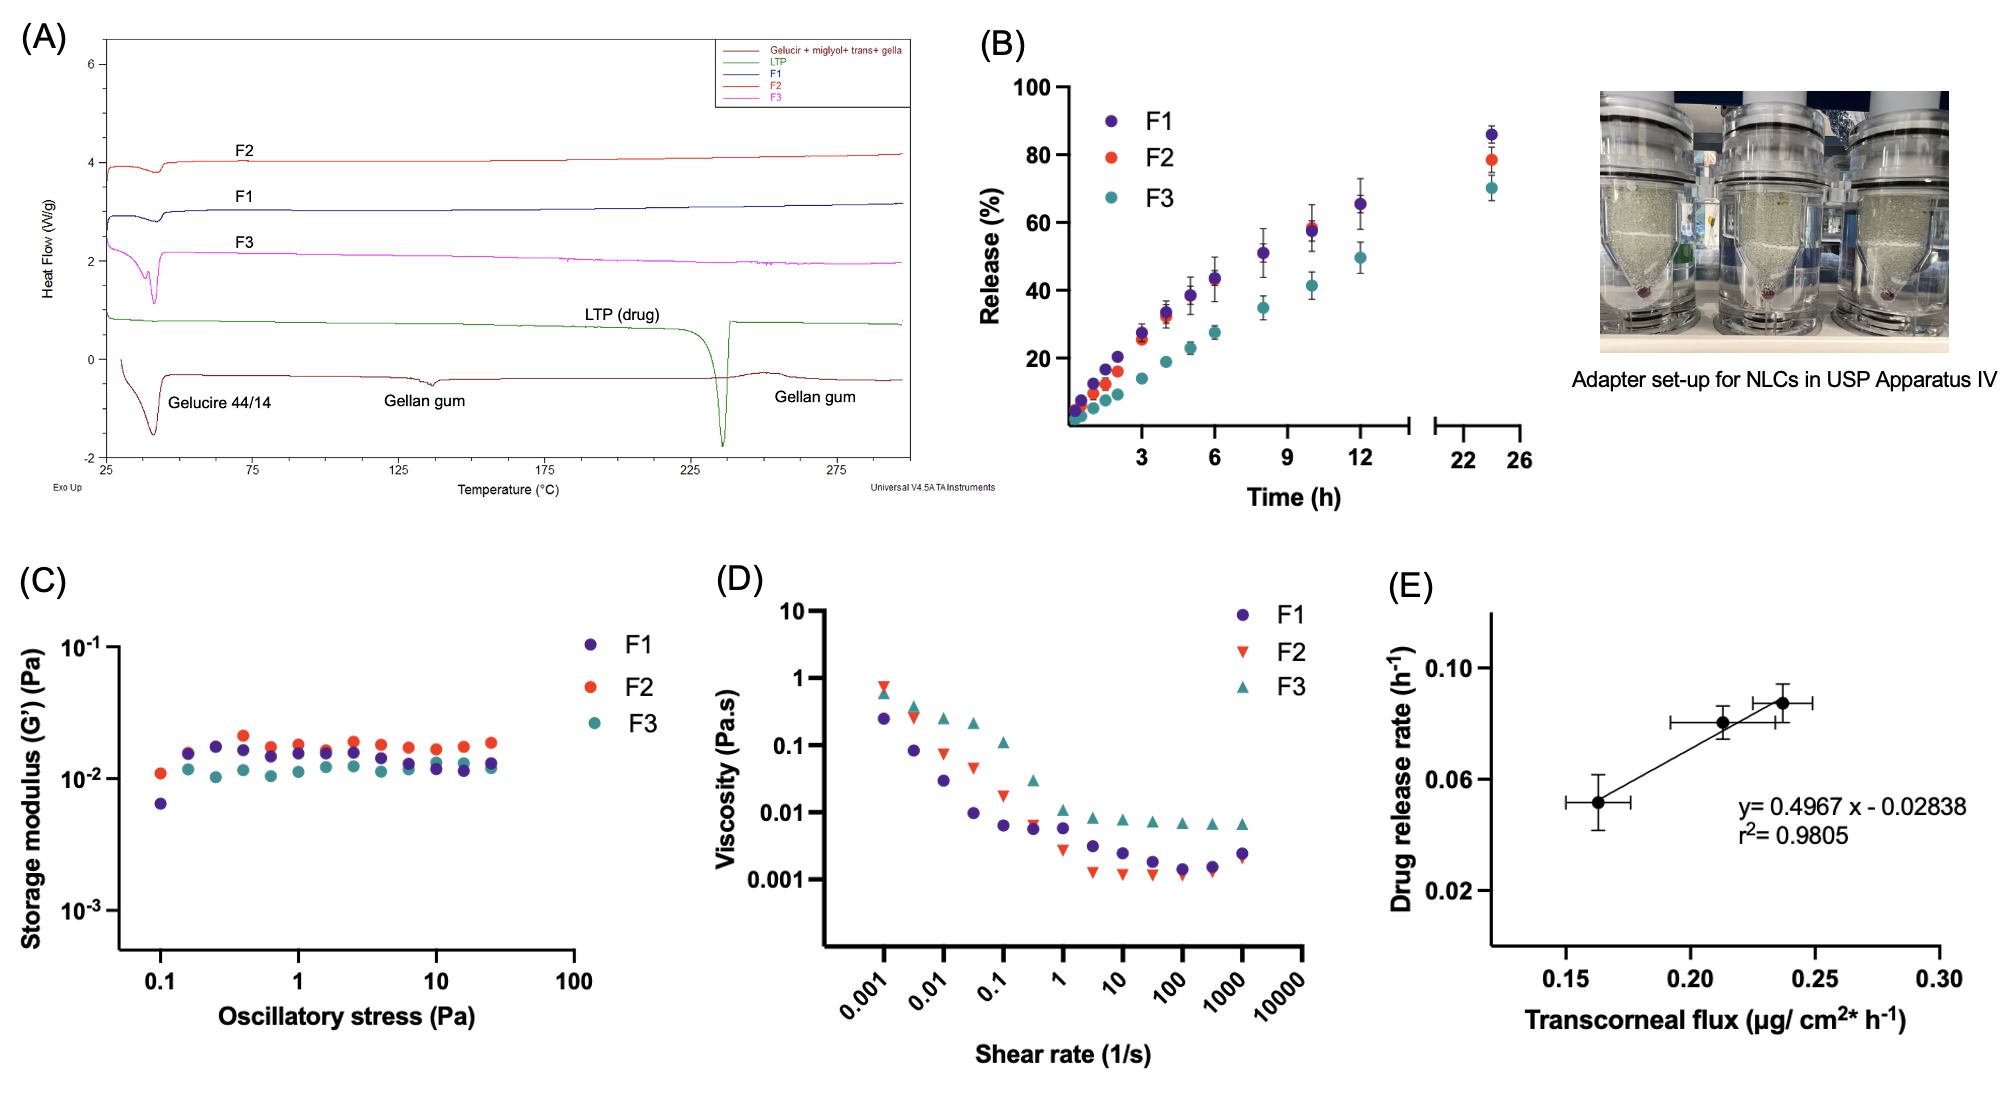 Fig. 2. A) Representative DSC thermograms of the prepared NLC formulations, drug, lipid mixture and polymer; B) in vitro drug release profiles of formulations using USP IV apparatus (formulations on a cellulose membrane holder sandwiched within glass beads along with a 50 nm PTFE filter in the filter head) (mean±SD, n=3); C) storage moduli (G’, Pa) of the NLC formulations as a function of oscillatory stress (mean±SD, n=3); D ) viscosity (η, Pa.s) of the NLC formulations as a function of shear rate (mean±SD, n=3); and E) in vitro-ex vivo correlation between drug release and transcorneal flux (mean±SD, n=3).
 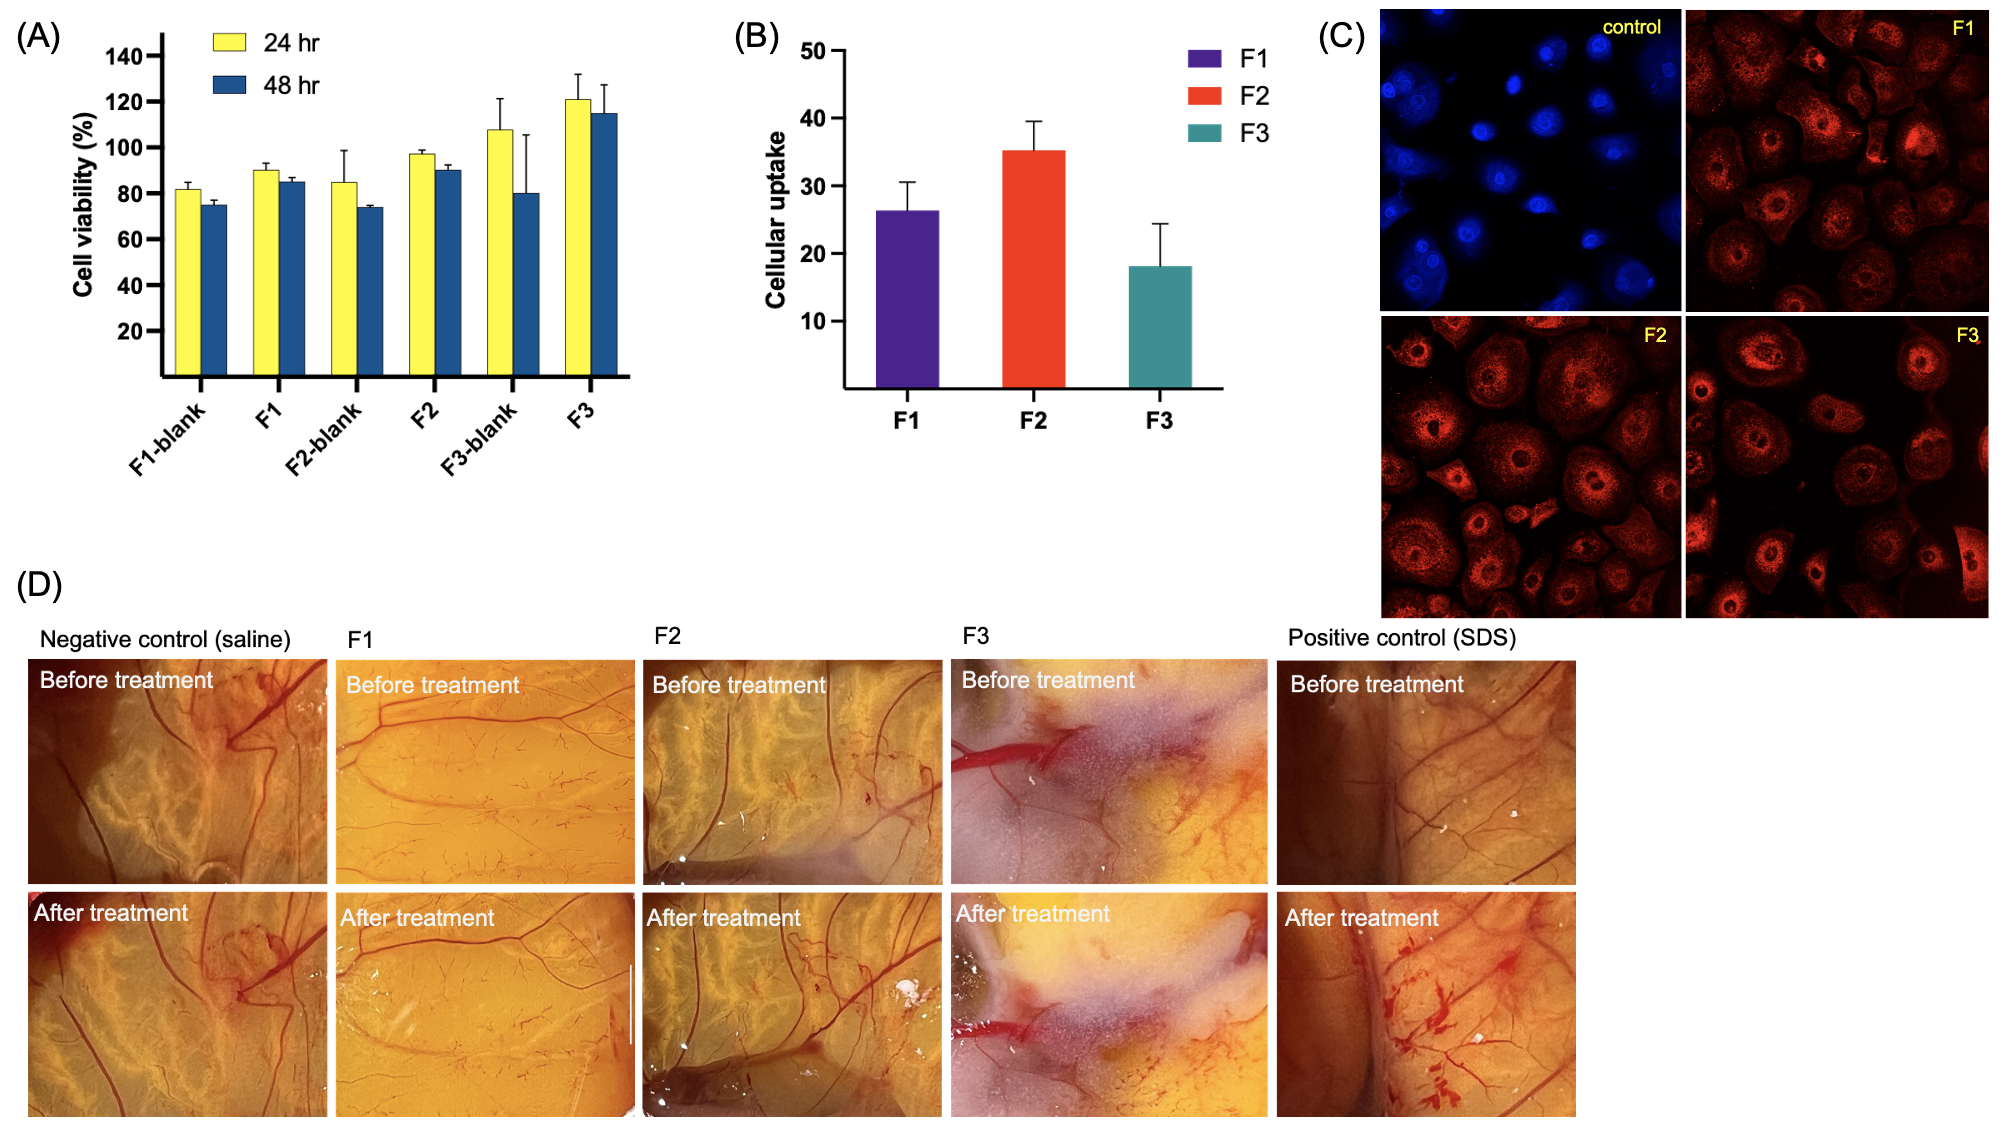 Fig. 3. A) Cell cytotoxicity study represented as %cell viability with respect to untreated cells determined using the CCK8 test at 24h and 48h incubation (mean±SD, n=6); B) quantitative cellular uptake studies using Nile red as the fluorescence marker determined using a fluorescence plate reader (incubation for 4h) (mean±SD, n=6); C) qualitative cellular uptake imaging of NLC formulations using confocal laser scanning microscope; and D) representative images of the ocular irritation test using hen’s egg-chorioallantoic membrane test for all the NLC formulations, negative control (saline), and positive control (SDS).