
Formulation and Delivery - Biomolecular
Category: Poster Abstract
 photo")
Khaled Galal, PhD (he/him/his)
Postdoctoral fellow
University of Texas at Austin
Austin, Texas, United States
Khaled Galal, PhD (he/him/his)
Postdoctoral fellow
University of Texas at Austin
Austin, Texas, United States
Benjamin Southard, BS
University of Texas at Austin
Austin, Texas, United States
Huy Minh Dao, Ph.D. (he/him/his)
University of Texas at Austin
Austin, Texas, United States
Robert Williams, Ph.D. (he/him/his)
University of Texas at Austin
Austin, Texas, United States
Zhengrong Cui, Ph.D. (he/him/his)
University of Texas at Austin
Austin, Texas, United States
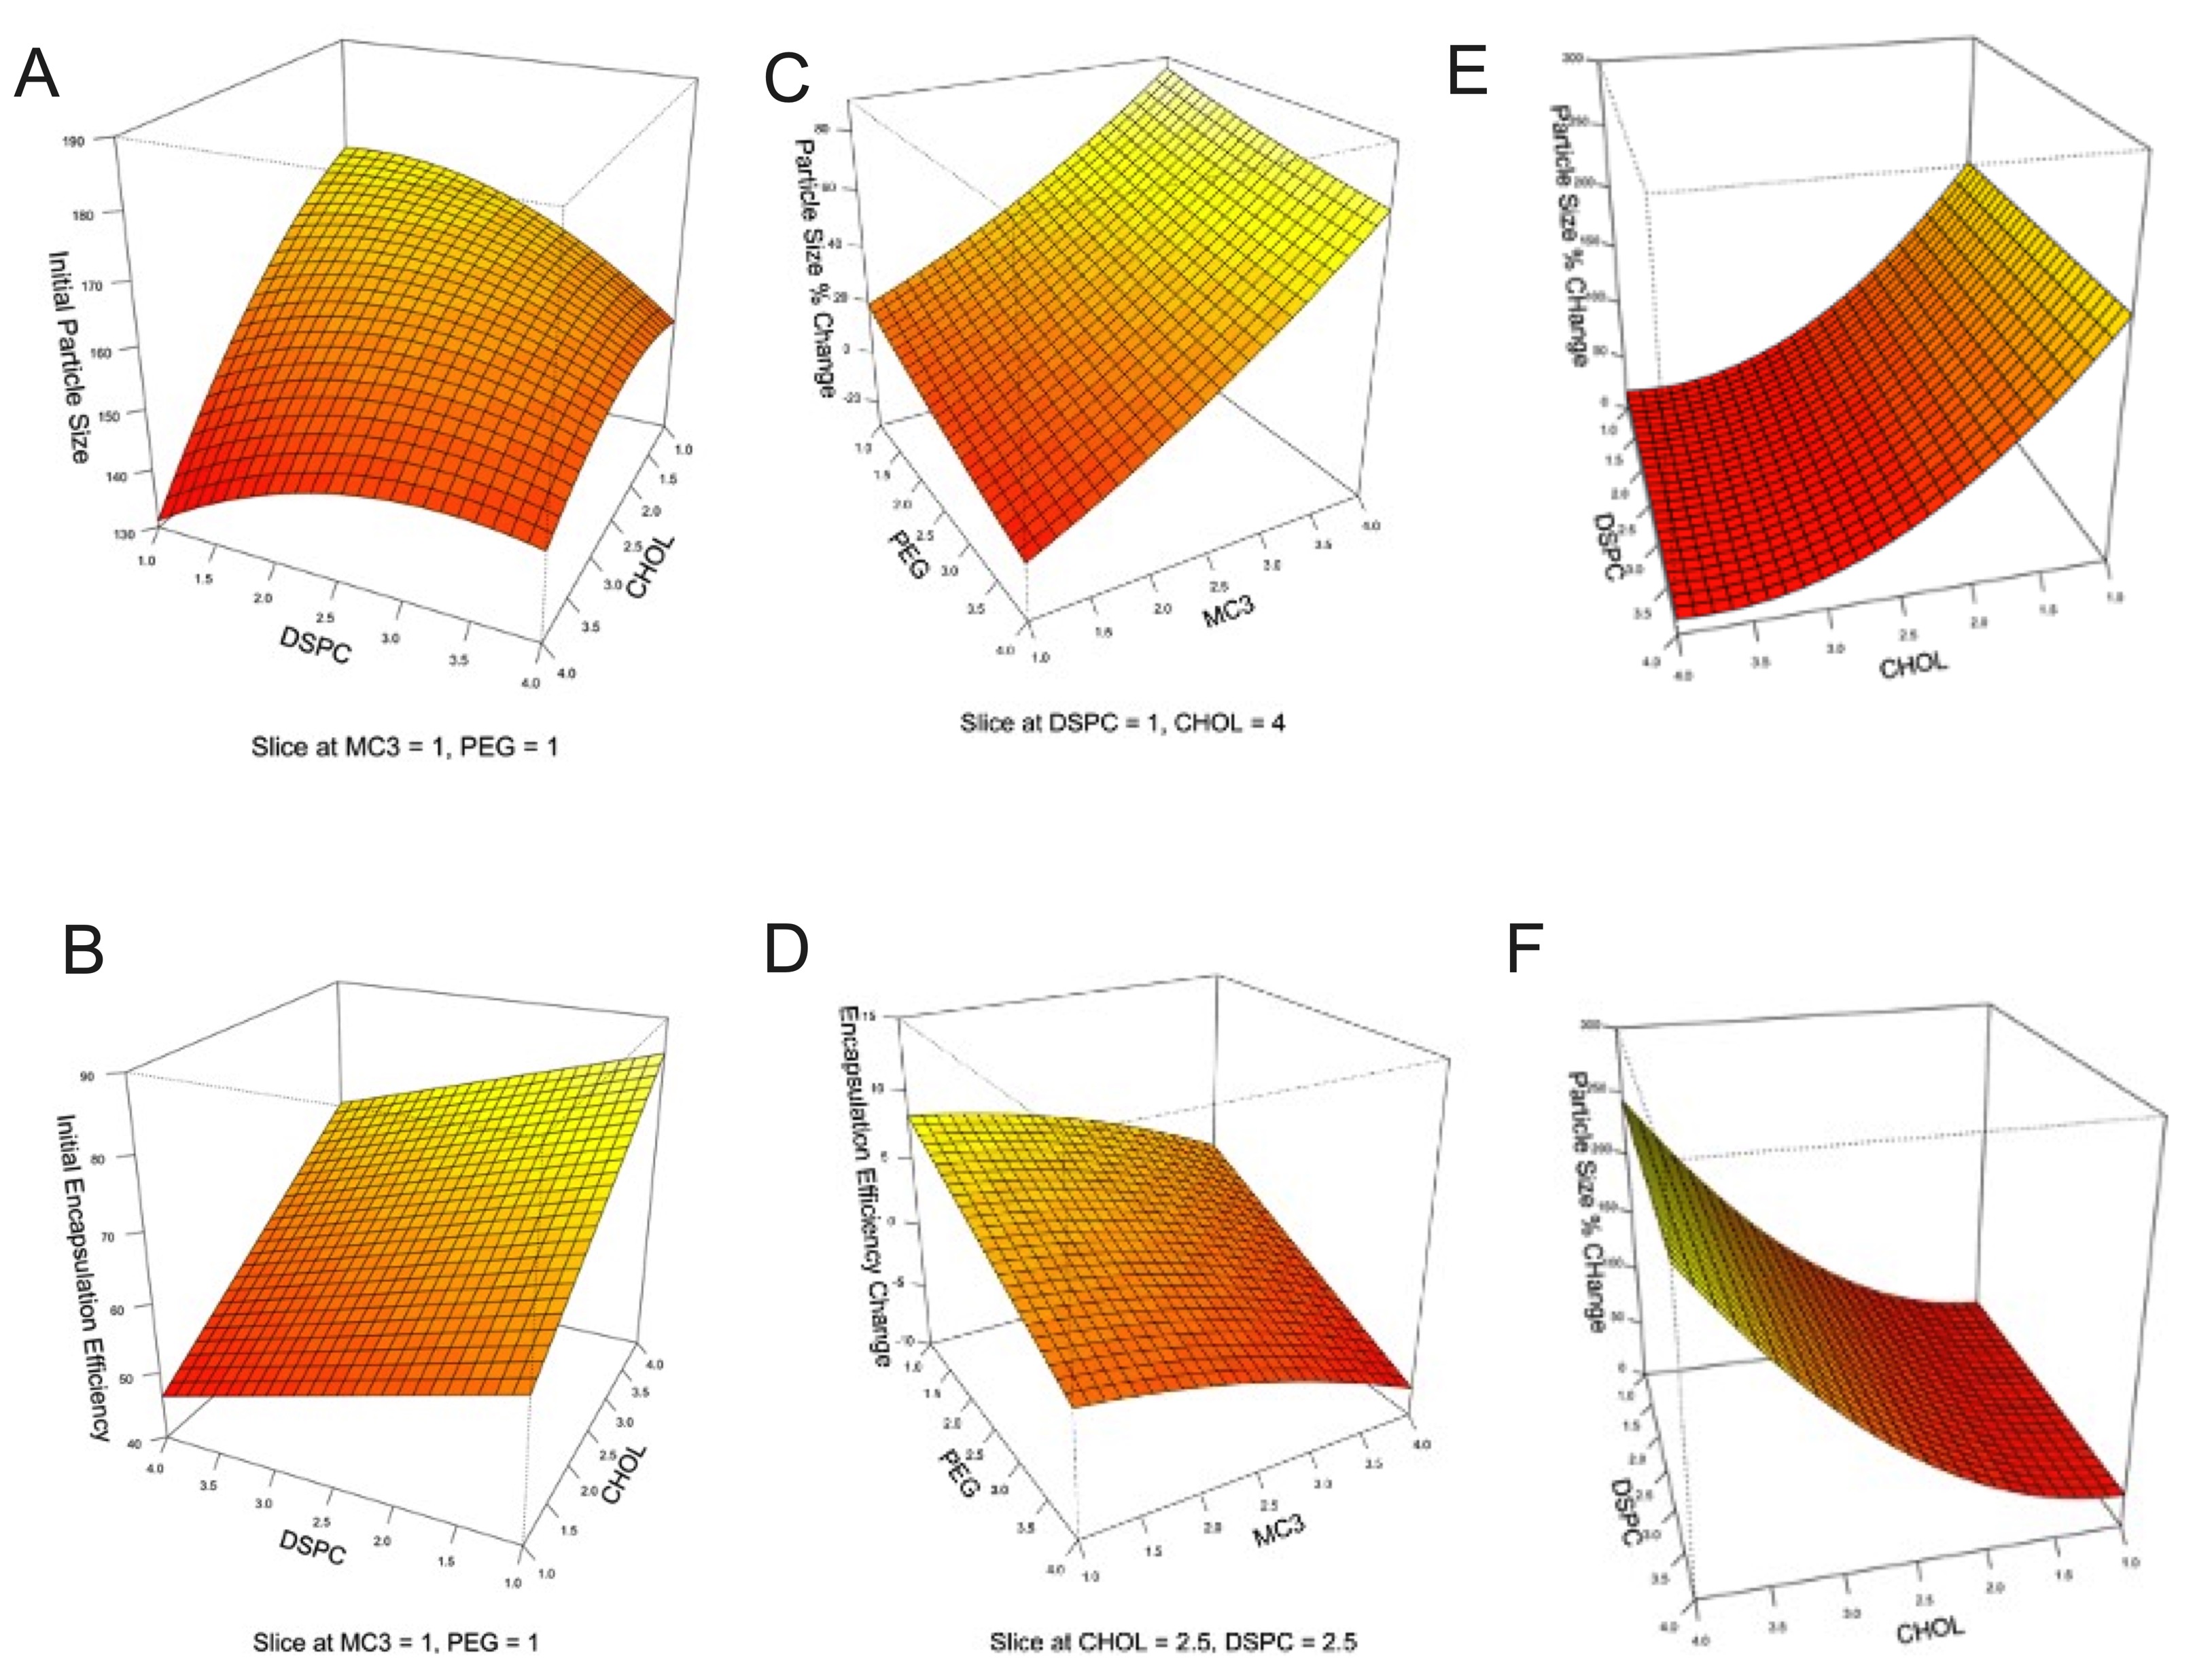 Fig. 1. The perspective plots of the effect of lipid molar ratios on (A) initial particle and (B) initial EE. (C-D) The perspective plots of the effect of lipid molar ratios on particle size and EE after storage of liquid formulations for 2 days at +4°C. (E-F) The perspective plots of the effect of lipid molar ratios on average particle size and EE after fast freezing at -80°C and thawing at +4°C.
 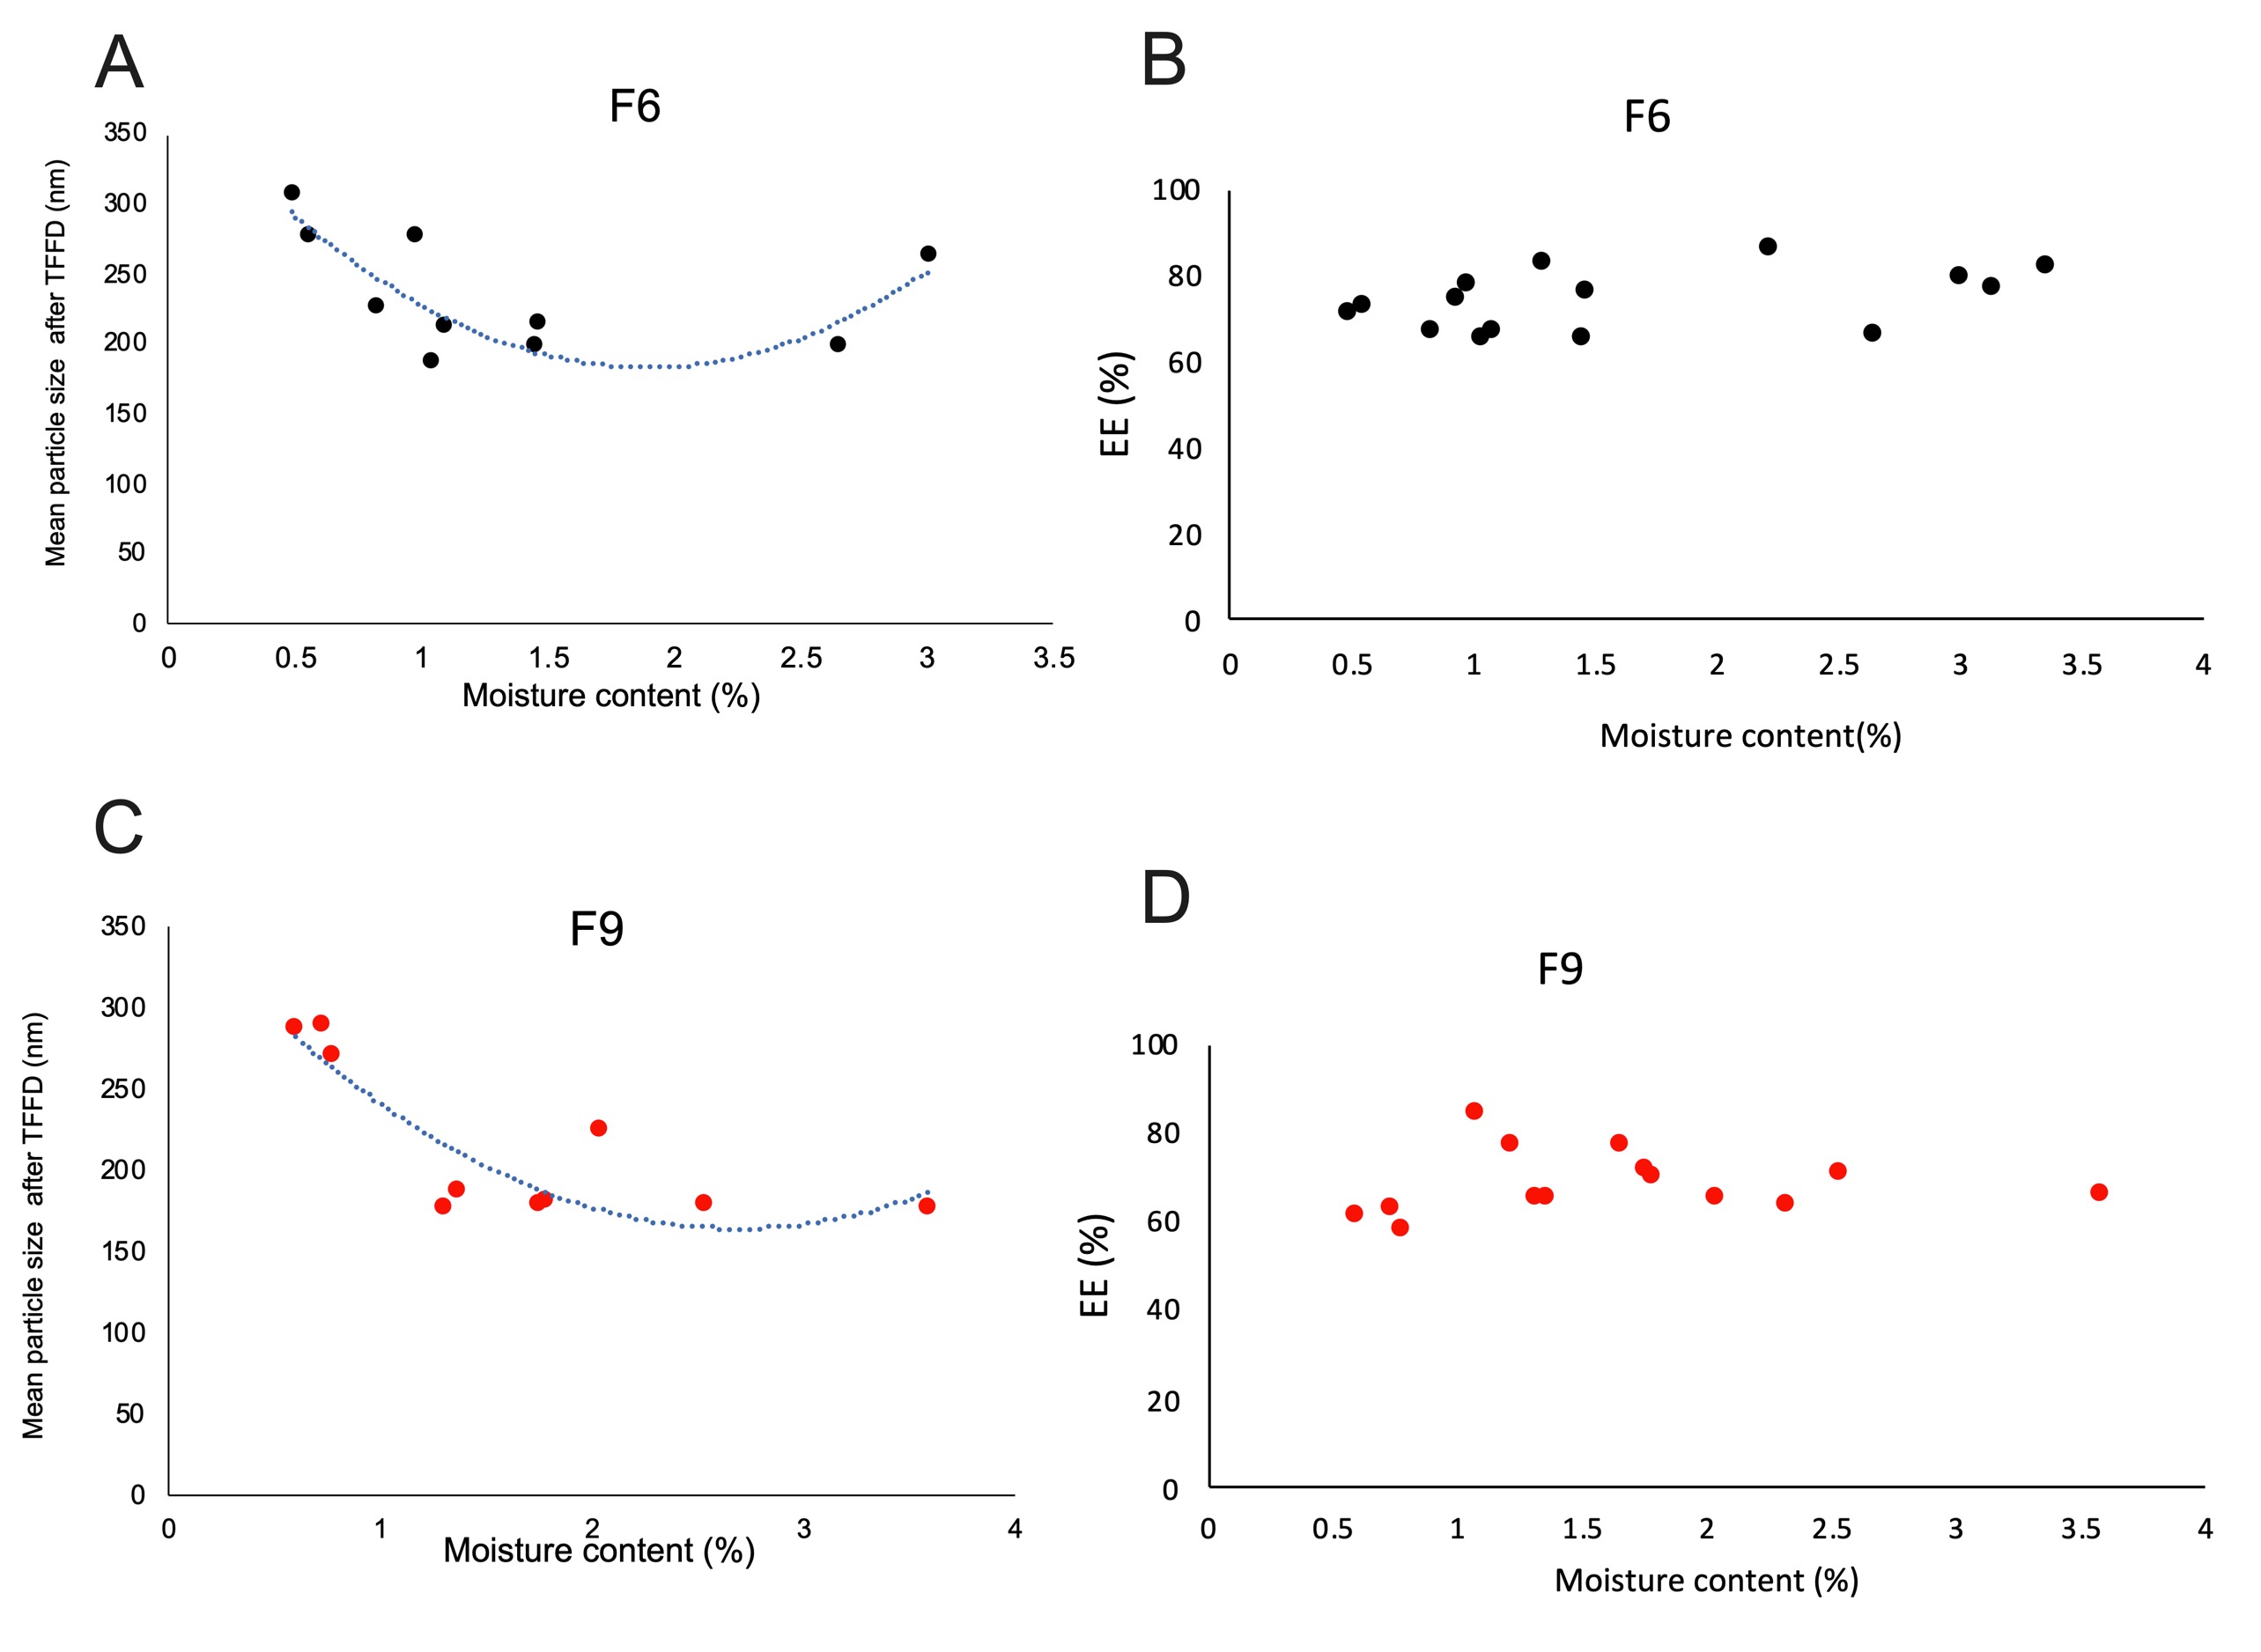 Fig. 2. Effect of powder moisture content on (A) a average particle size of F6, (B) EE of F6, (C) average particle size of F9 and (D) EE of F9.
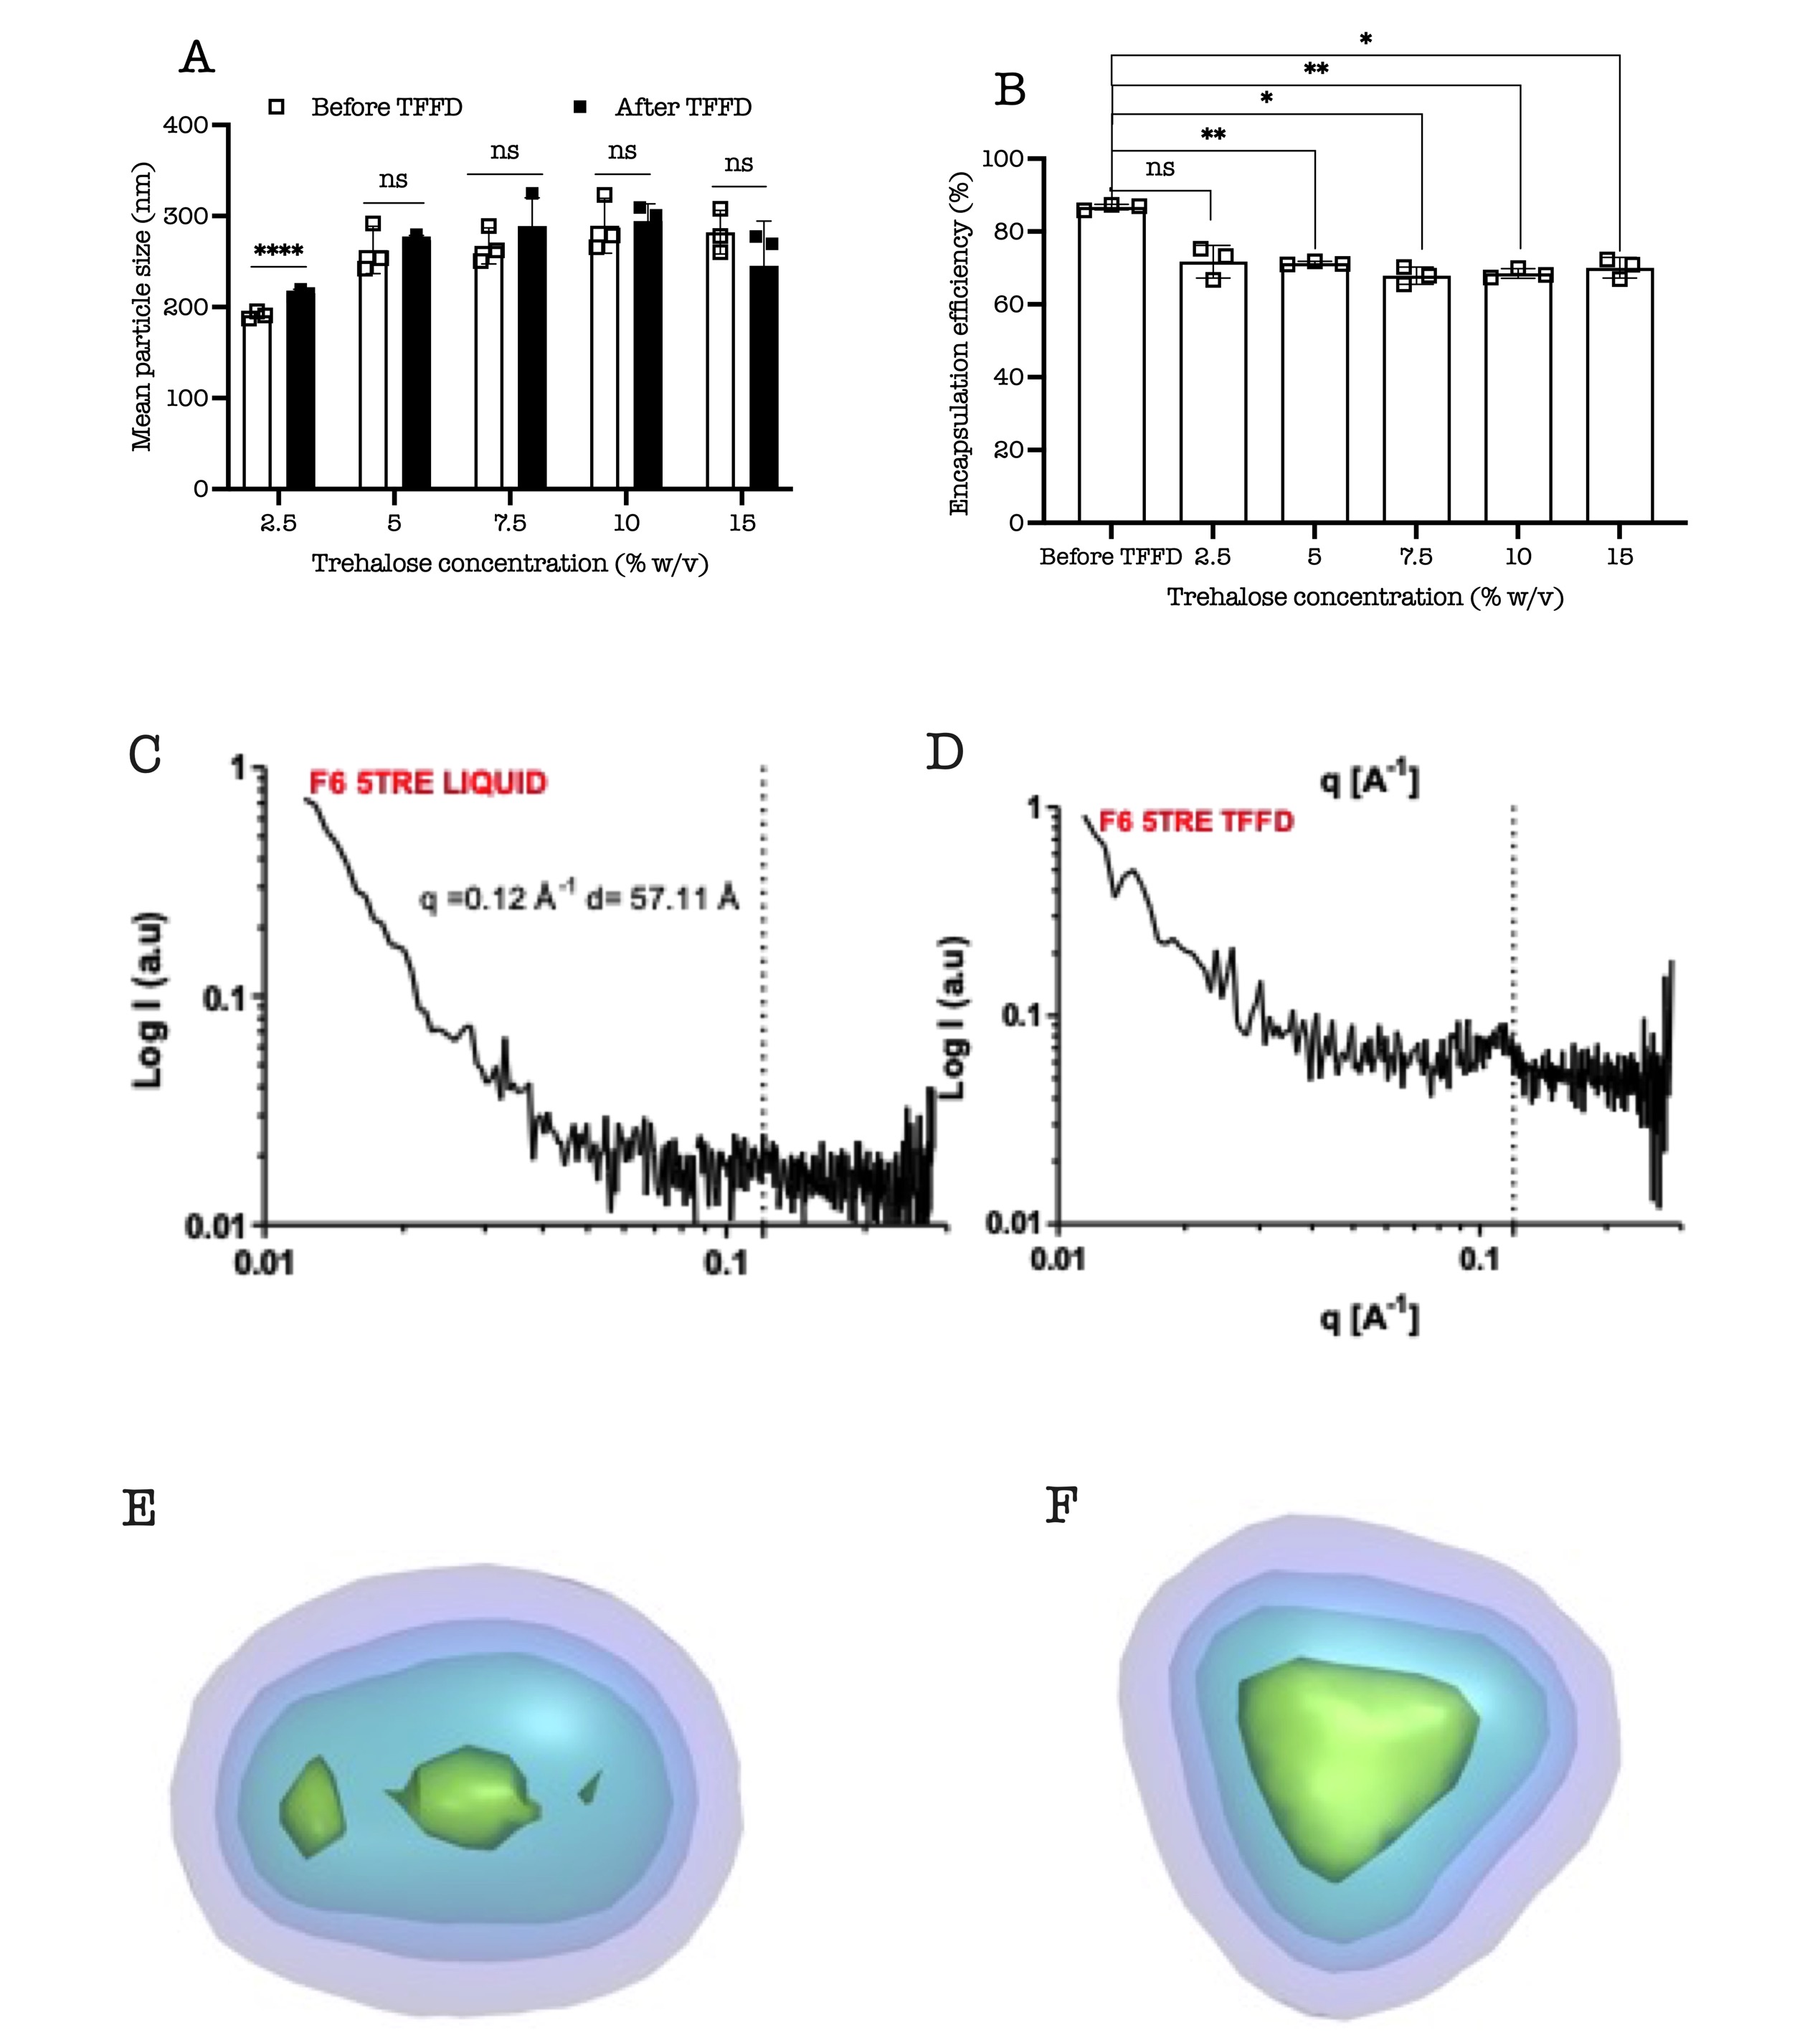 Fig. 3. Characterization of poly(A) LNPs. (A) Mean particle size of poly(A) LNPs containing various concentrations of trehalose before TFFD and after TFFD and reconstitution and (B) EE of poly(A) in the LNPs before TFFD and after TFFD and reconstitution. Formulations containing different trehalose concentrations showed similar poly(A) EE in the LNPs before TFFD. Data are mean ± S.D. (n =3). ns: no significant difference between the means of different groups, *p≤0.05, **p≤0.01, ****p≤0.0001. (C) SAXS scattering profile of F6 in 5% w/v trehalose before (LIQUID) and (D) after TFFD. (E-F) Electron density reconstructions from experimental solution scattering data for F6 in 5% w/v trehalose (E) before, and (F) after TFFD. Electron density are shown in surfaces with 1, 2, 5, 10 σ from the average electron density of the particle.