
Formulation and Delivery - Chemical
Category: Late Breaking Poster Abstract

Benjamin M. Yee, M.S.
Graduate Student
Rutgers University Ernest Mario School of Pharmacy
Highland Park, New Jersey, United States
Benjamin M. Yee, M.S.
Graduate Student
Rutgers University Ernest Mario School of Pharmacy
Highland Park, New Jersey, United States
Tomas Roldan
Rutgers University Ernest Mario School of Pharmacy
Piscataway, New Jersey, United States
Dipti Kakkar Thukral
Rutgers University Ernest Mario School of Pharmacy
Piscataway, New Jersey, United States
Dayuan Gao, Ph.D.
Rutgers University Ernest Mario School of Pharmacy
Piscataway, New Jersey, United States
Shike Li, M.D.
Rutgers University Ernest Mario School of Pharmacy
Piscataway, New Jersey, United States
Patrick J. Sinko, Ph.D., R.Ph.
Rutgers University Ernest Mario School of Pharmacy
Piscataway, New Jersey, United States
.jpg) Figure 2: Polymer Synergy Screening. Binary polymer combinations were screened for potential synergy. Amplitude oscillation was performed on singular polymer and polymer combinations in the presence of STF (n = 1).
Figure 2: Polymer Synergy Screening. Binary polymer combinations were screened for potential synergy. Amplitude oscillation was performed on singular polymer and polymer combinations in the presence of STF (n = 1).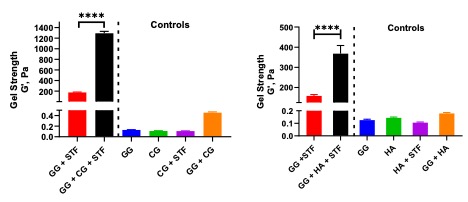 Figure 5: Synergism in novel combinations. A. Amplitude oscillation performed on samples of gellan gum (GG) and carrageenan (CG) with and without STF as singular polymer samples and binary polymer combinations (n = 3). *, P < 0.0001, Student’s t test, GG + CG + STF vs GG + STF (n = 3). B. Amplitude oscillation performed as in A on samples of gellan gum (GG) and hyaluronan (HA) (n = 3). *, P < 0.0001, Student’s t test, GG + HA + STF vs GG + STF (n = 3).
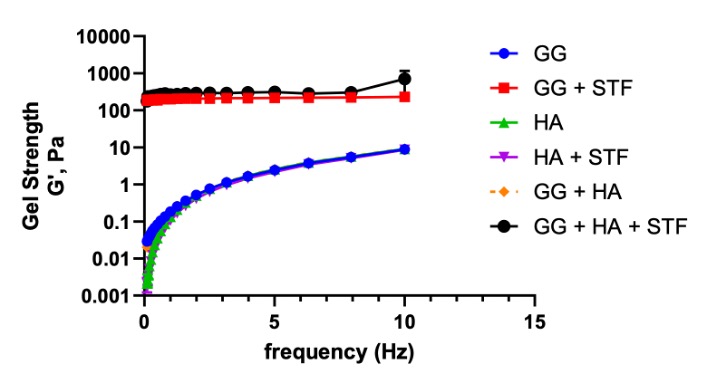 Figure 6: Frequency independence. Frequency test performed on samples of gellan gum (GG) and hyaluronan (HA) with and without STF as singular polymer samples and binary polymer combinations (n = 3). A straight curve is indicative of frequency independence and characteristic of a solid substance.