
Formulation and Delivery - Chemical
Category: Poster Abstract

Jingyi Ma, BS
Research Assistant
University of Nebraska Medical Center
Omaha, Nebraska, United States
Virender Kumar, Ph.D.
University of Nebraska Medical Center
omaha, Nebraska, United States
Ram I. Mahato, Ph.D.
University of Nebraska Medical Center
OMAHA, Nebraska, United States
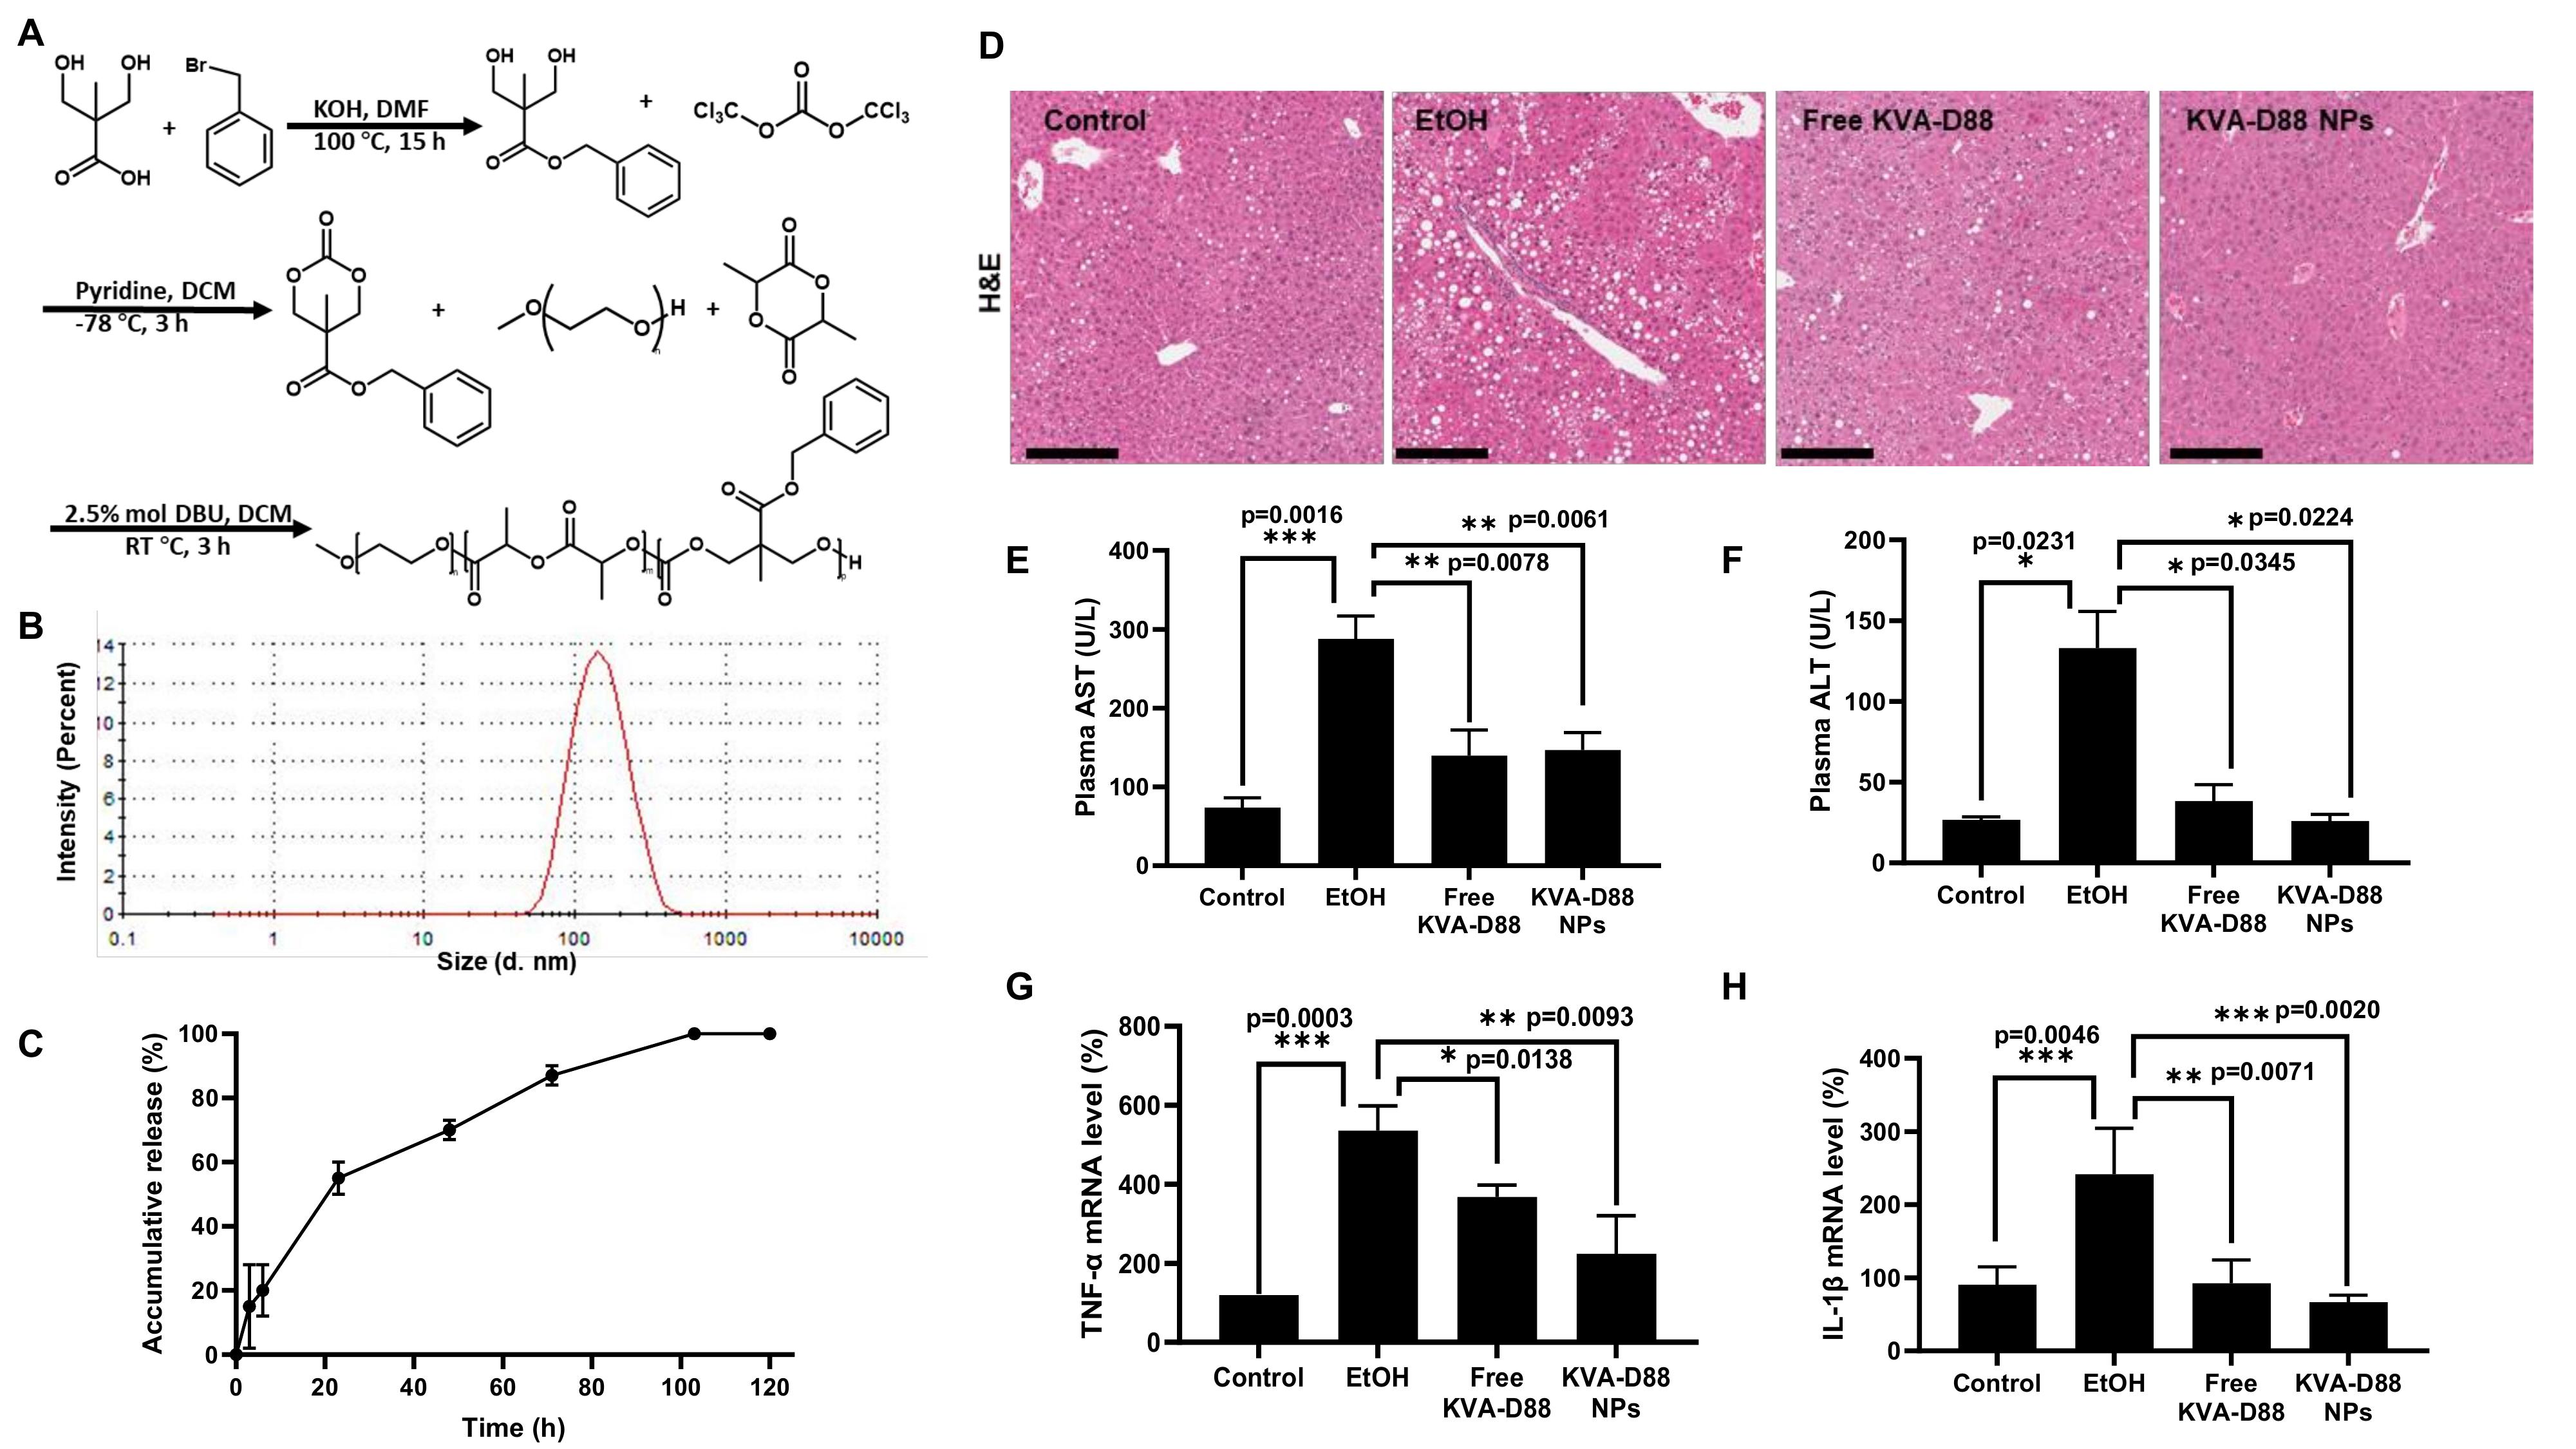 Figure1. Preparation, characterization, and in vivo efficacy of KVA-D88 loaded nanoparticles. (A) Synthesis of mPEGb-P(CB-co-LA). (B) Particle size distribution of KVA-D88 loaded nanoparticles. (C) Release profile of KVA-D88 loaded nanoparticles in PBS. (D) Representative microscopic pictures of H&E staining of mice liver tissue. Scale bars (20×), 200 µm. (E, F) Mice plasma AST and ALT levels. (G, H) Mice hepatic mRNA expression level of TNF-α and IL-1β. Results are presented as the mean ± SD (n = 3). * p < 0.05, ** p < 0.01 and *** p < 0.005.
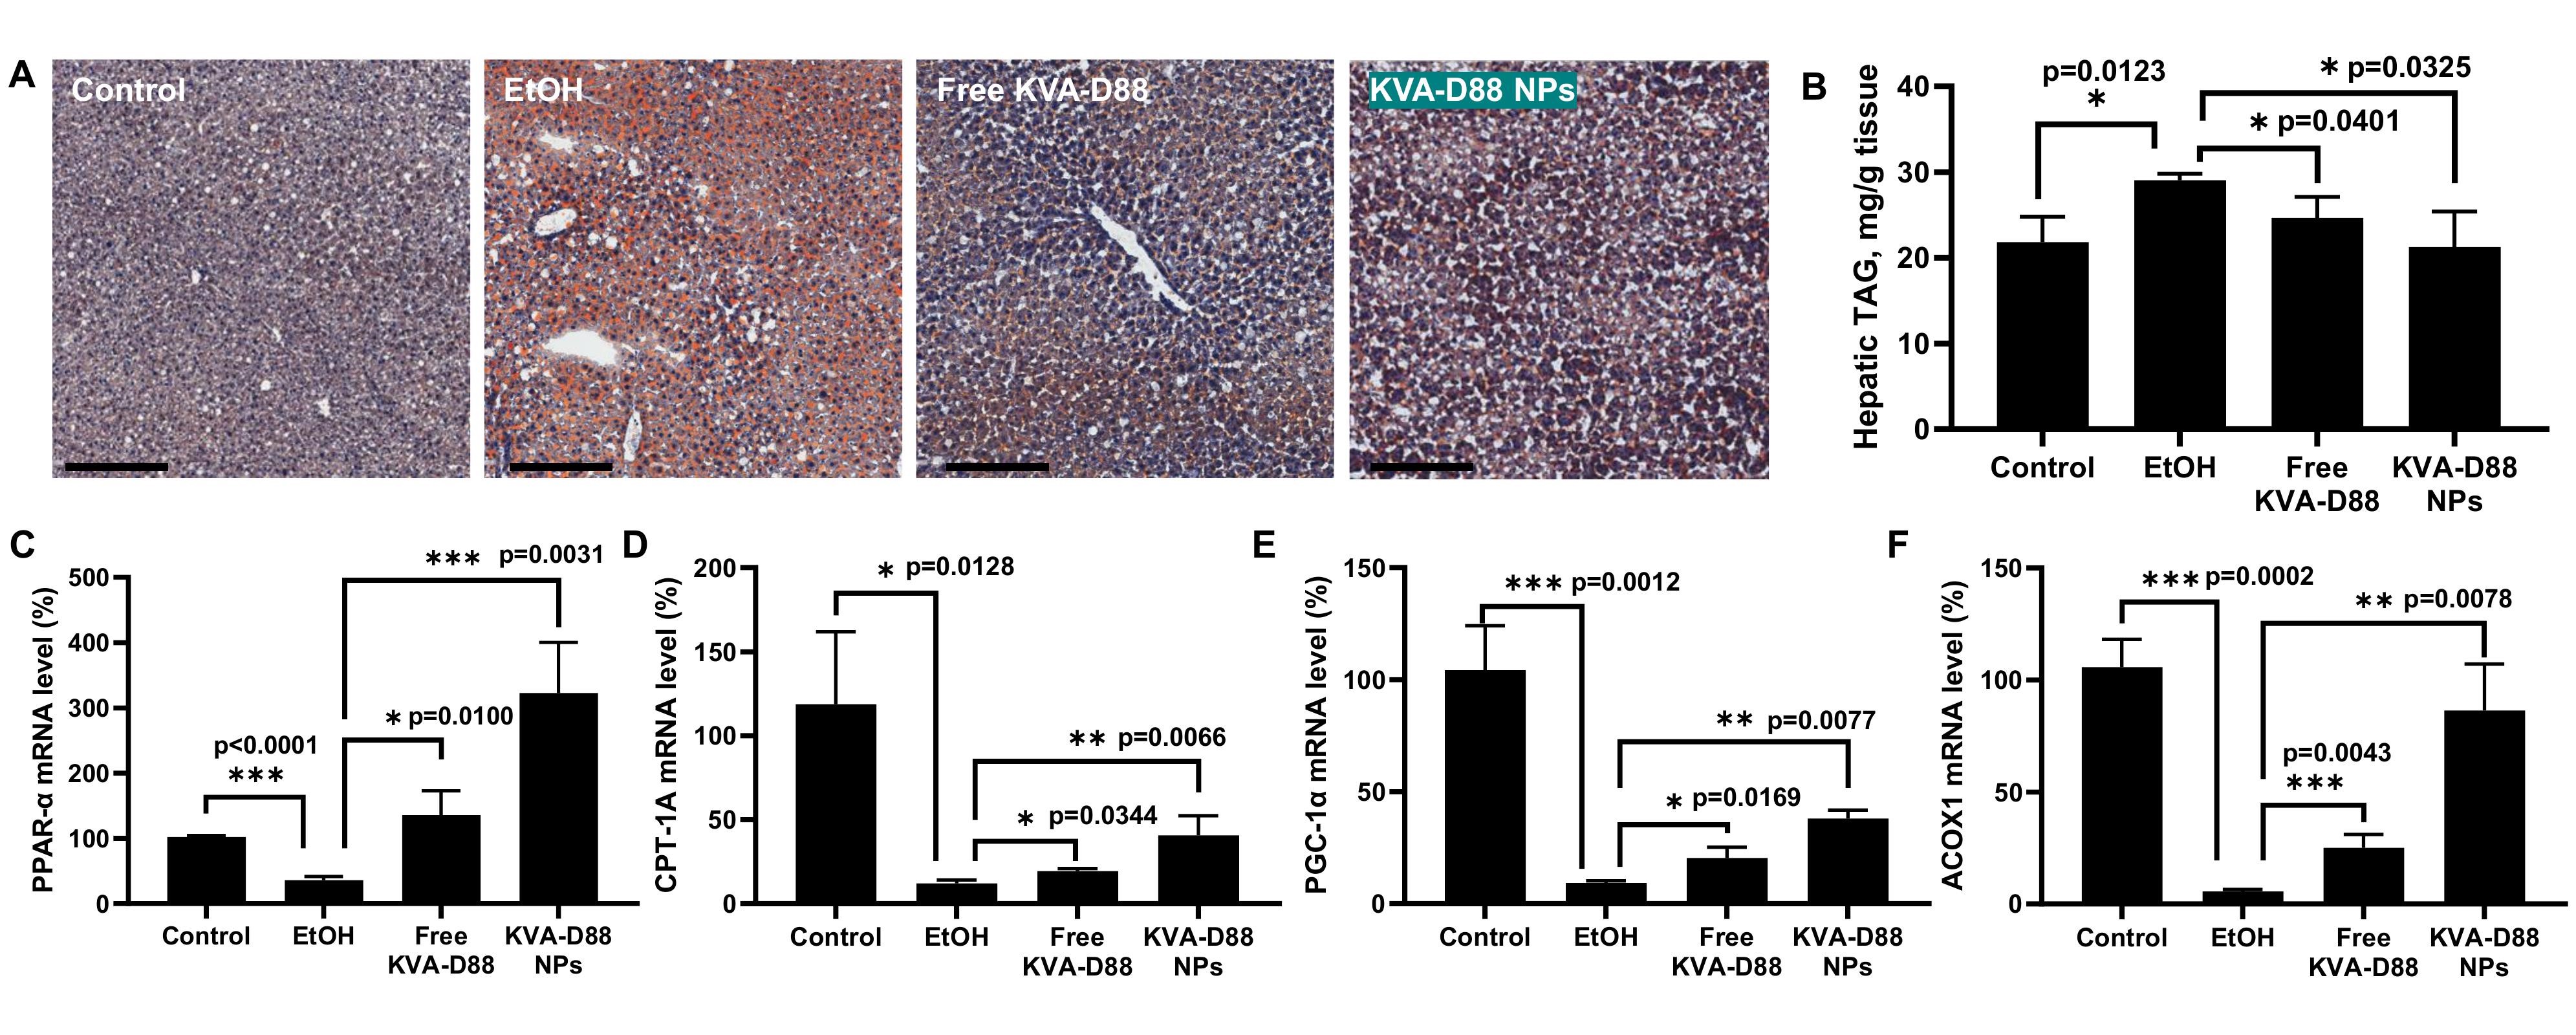 Figure 2. KVA-D88 loaded nanoparticles alleviate alcohol-induced steatosis and promote lipolysis-related gene expression in the liver after systemic administration into mice. (A) Representative microscopic pictures of Oil red O staining of mice liver tissue. (B) Mice hepatic triglyceride (TG), also known as triacylglycerol (TAG) level. Mice hepatic mRNA expression levels of PPAR-α (C), CPT-1A (D), PGC-1α (E), and ACOX1 (F). Scale bars (20×), 200 μm. Results are presented as the mean ± SD (n = 3). *P < 0.05, **P < 0.01, and ***P < 0.005.
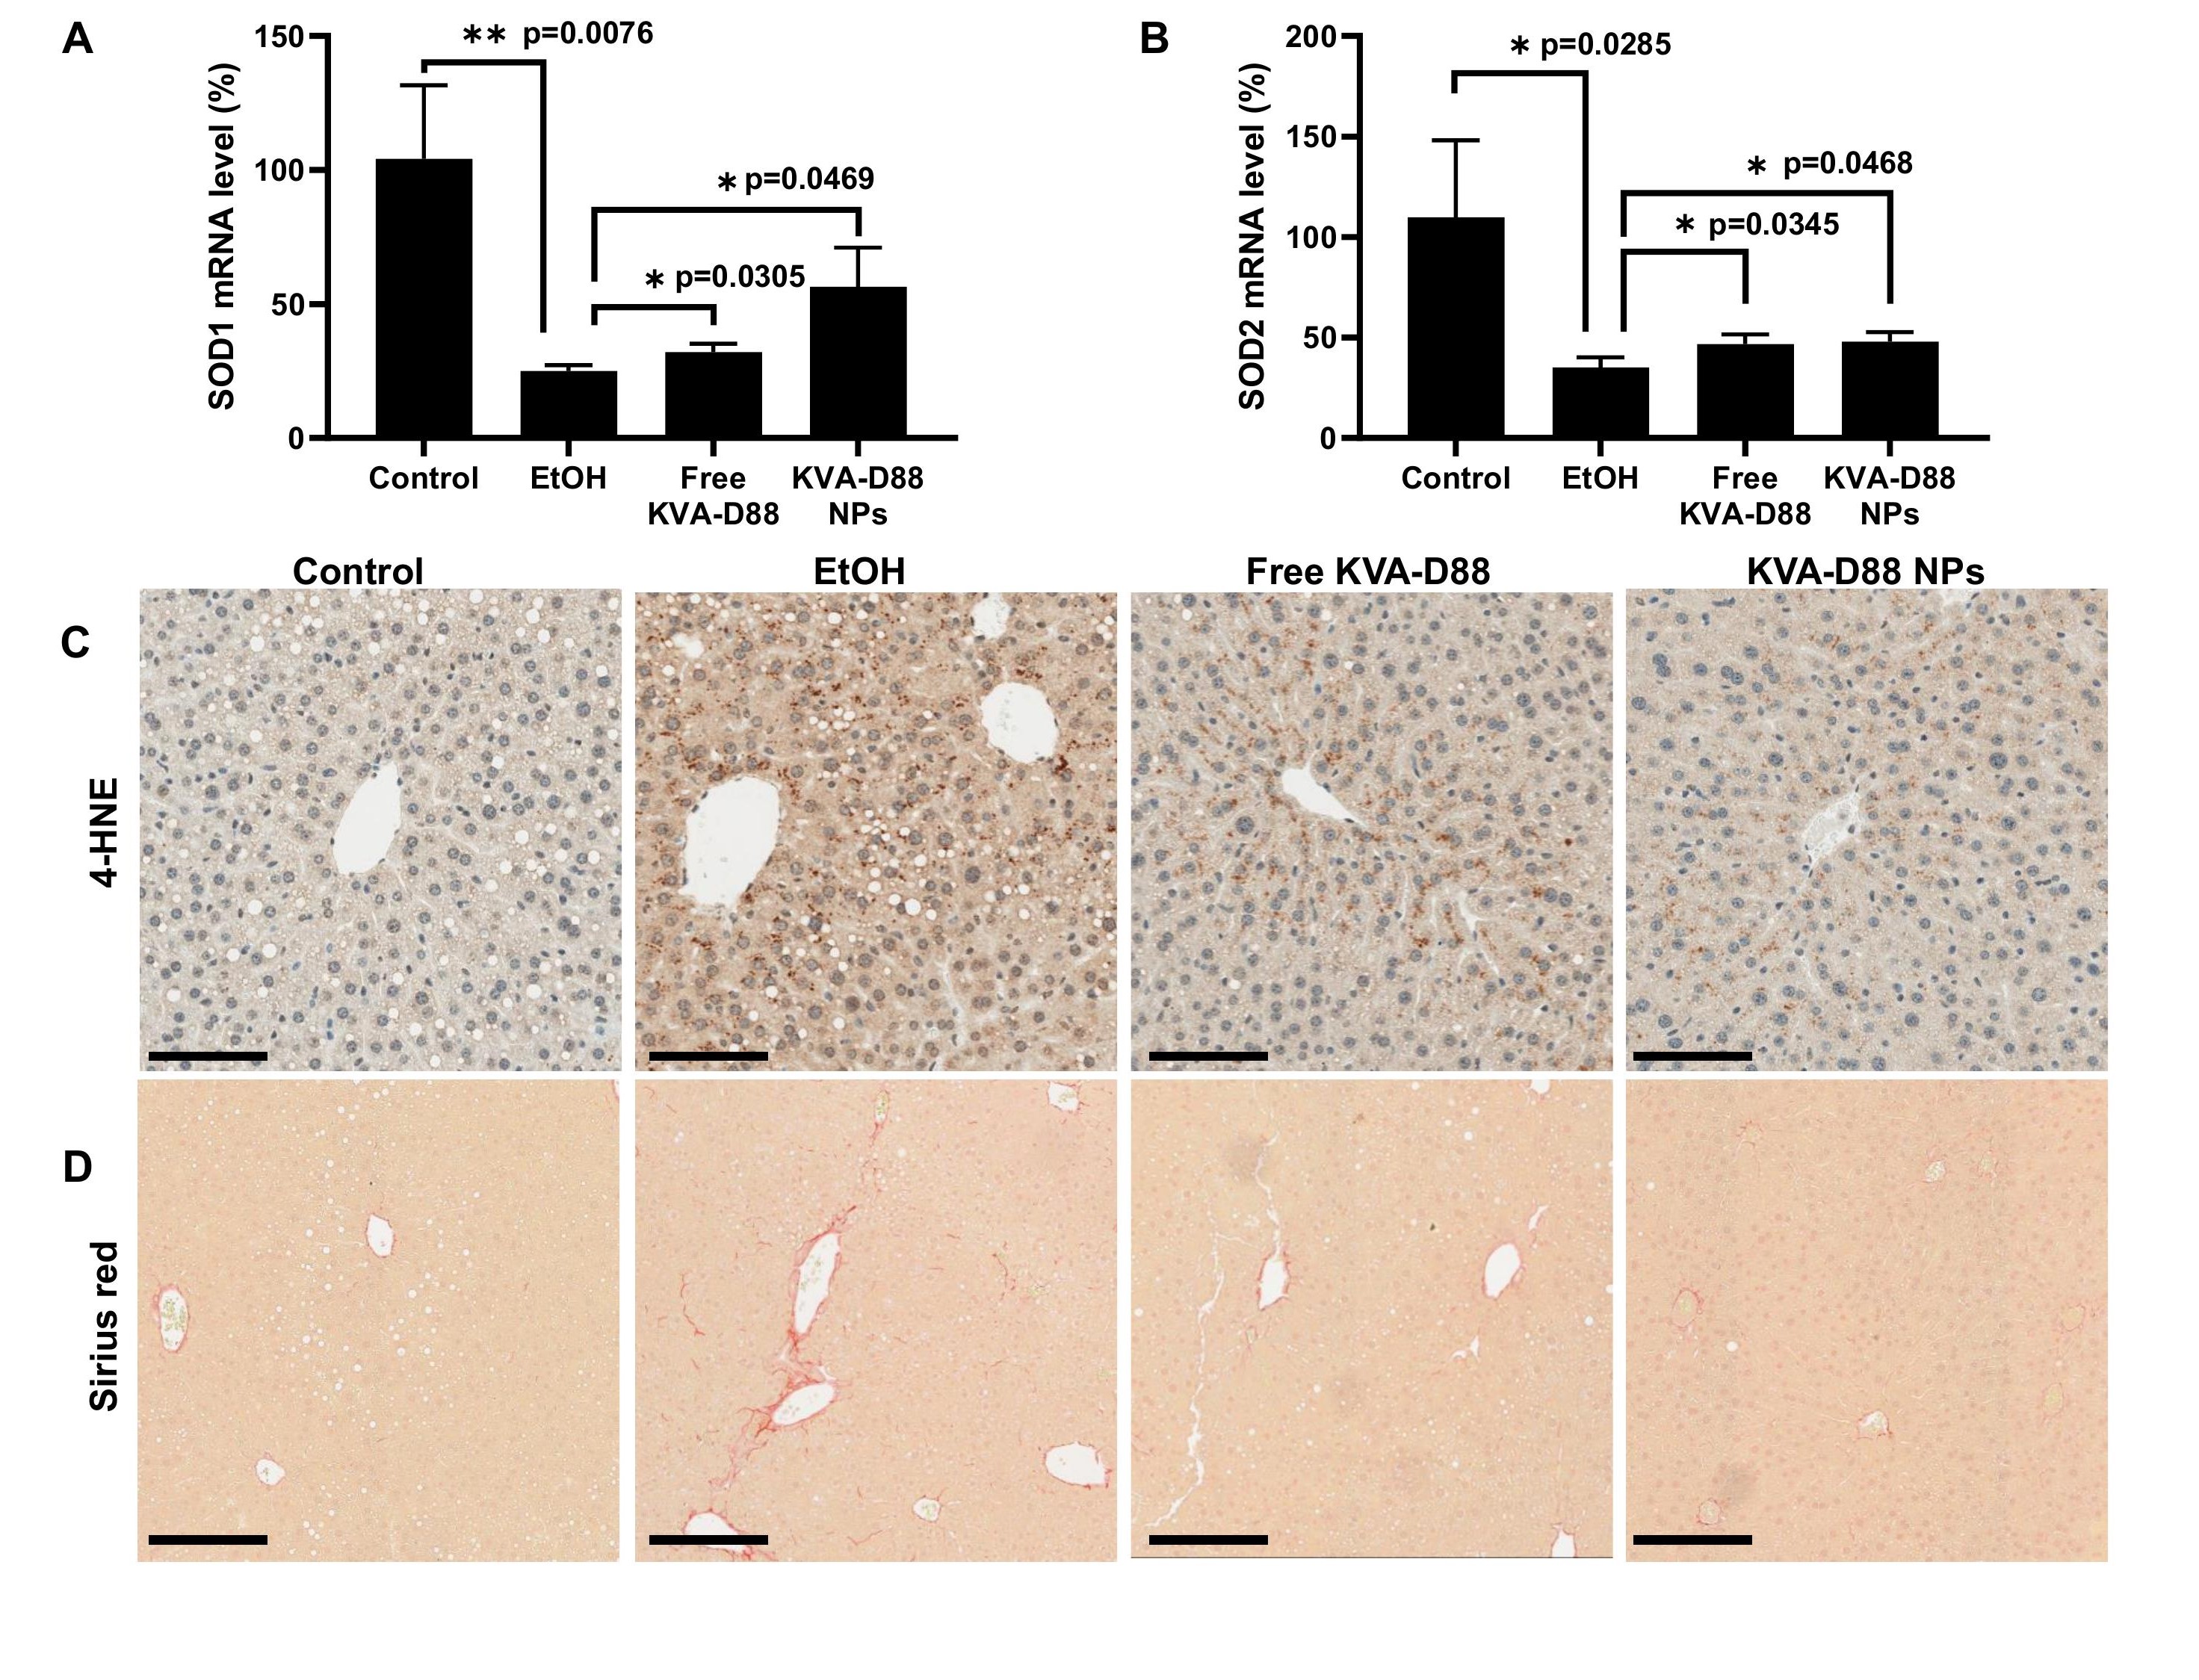 Figure 3. KVA-D88 loaded nanoparticles alleviate alcohol-induced oxidative stress and fibrosis after systemic administration into mice. (A, B) Mice hepatic mRNA expression levels of SOD1 and SOD2. (C) Representative microscopic pictures of IHC staining for 4-HNE. (D) Representative microscopic pictures of Sirius red staining of mice liver tissue. Scale bars (20×), 200 μm. Results are presented as the mean ± SD (n = 3). *P < 0.05, **P < 0.01, and ***P < 0.005.