
Formulation and Delivery - Chemical
Category: Poster Abstract
Iria Seoane-Viano, Ph.D.
University College London
London, England, United Kingdom
Thomas Pollard, BA
University College London
LONDON, England, United Kingdom
Jun Jie Ong, B.S. (he/him/his)
University College London
LONDON, England, United Kingdom
 photo")
Patricija Januskaite, M.S. (she/her/hers)
PhD student
University College London
LONDON, England, United Kingdom
Sahar Awwad, Ph.D.
University College London
LONDON, England, United Kingdom
Mine Orlu, Ph.D.
University College London
LONDON, England, United Kingdom
Manuel Bande, M.D.
University Clinical Hospital of Santiago de Compostela
SANTIAGO DE COMPOSTELA, Galicia, Spain
Alvaro Goyanes, Ph.D.
FabRx Ltd.
London, England, United Kingdom
Abdul Basit, Ph.D.
University College London
London, England, United Kingdom
.jpg) Figure 1. Different angles of the printed contact lens.
Figure 1. Different angles of the printed contact lens.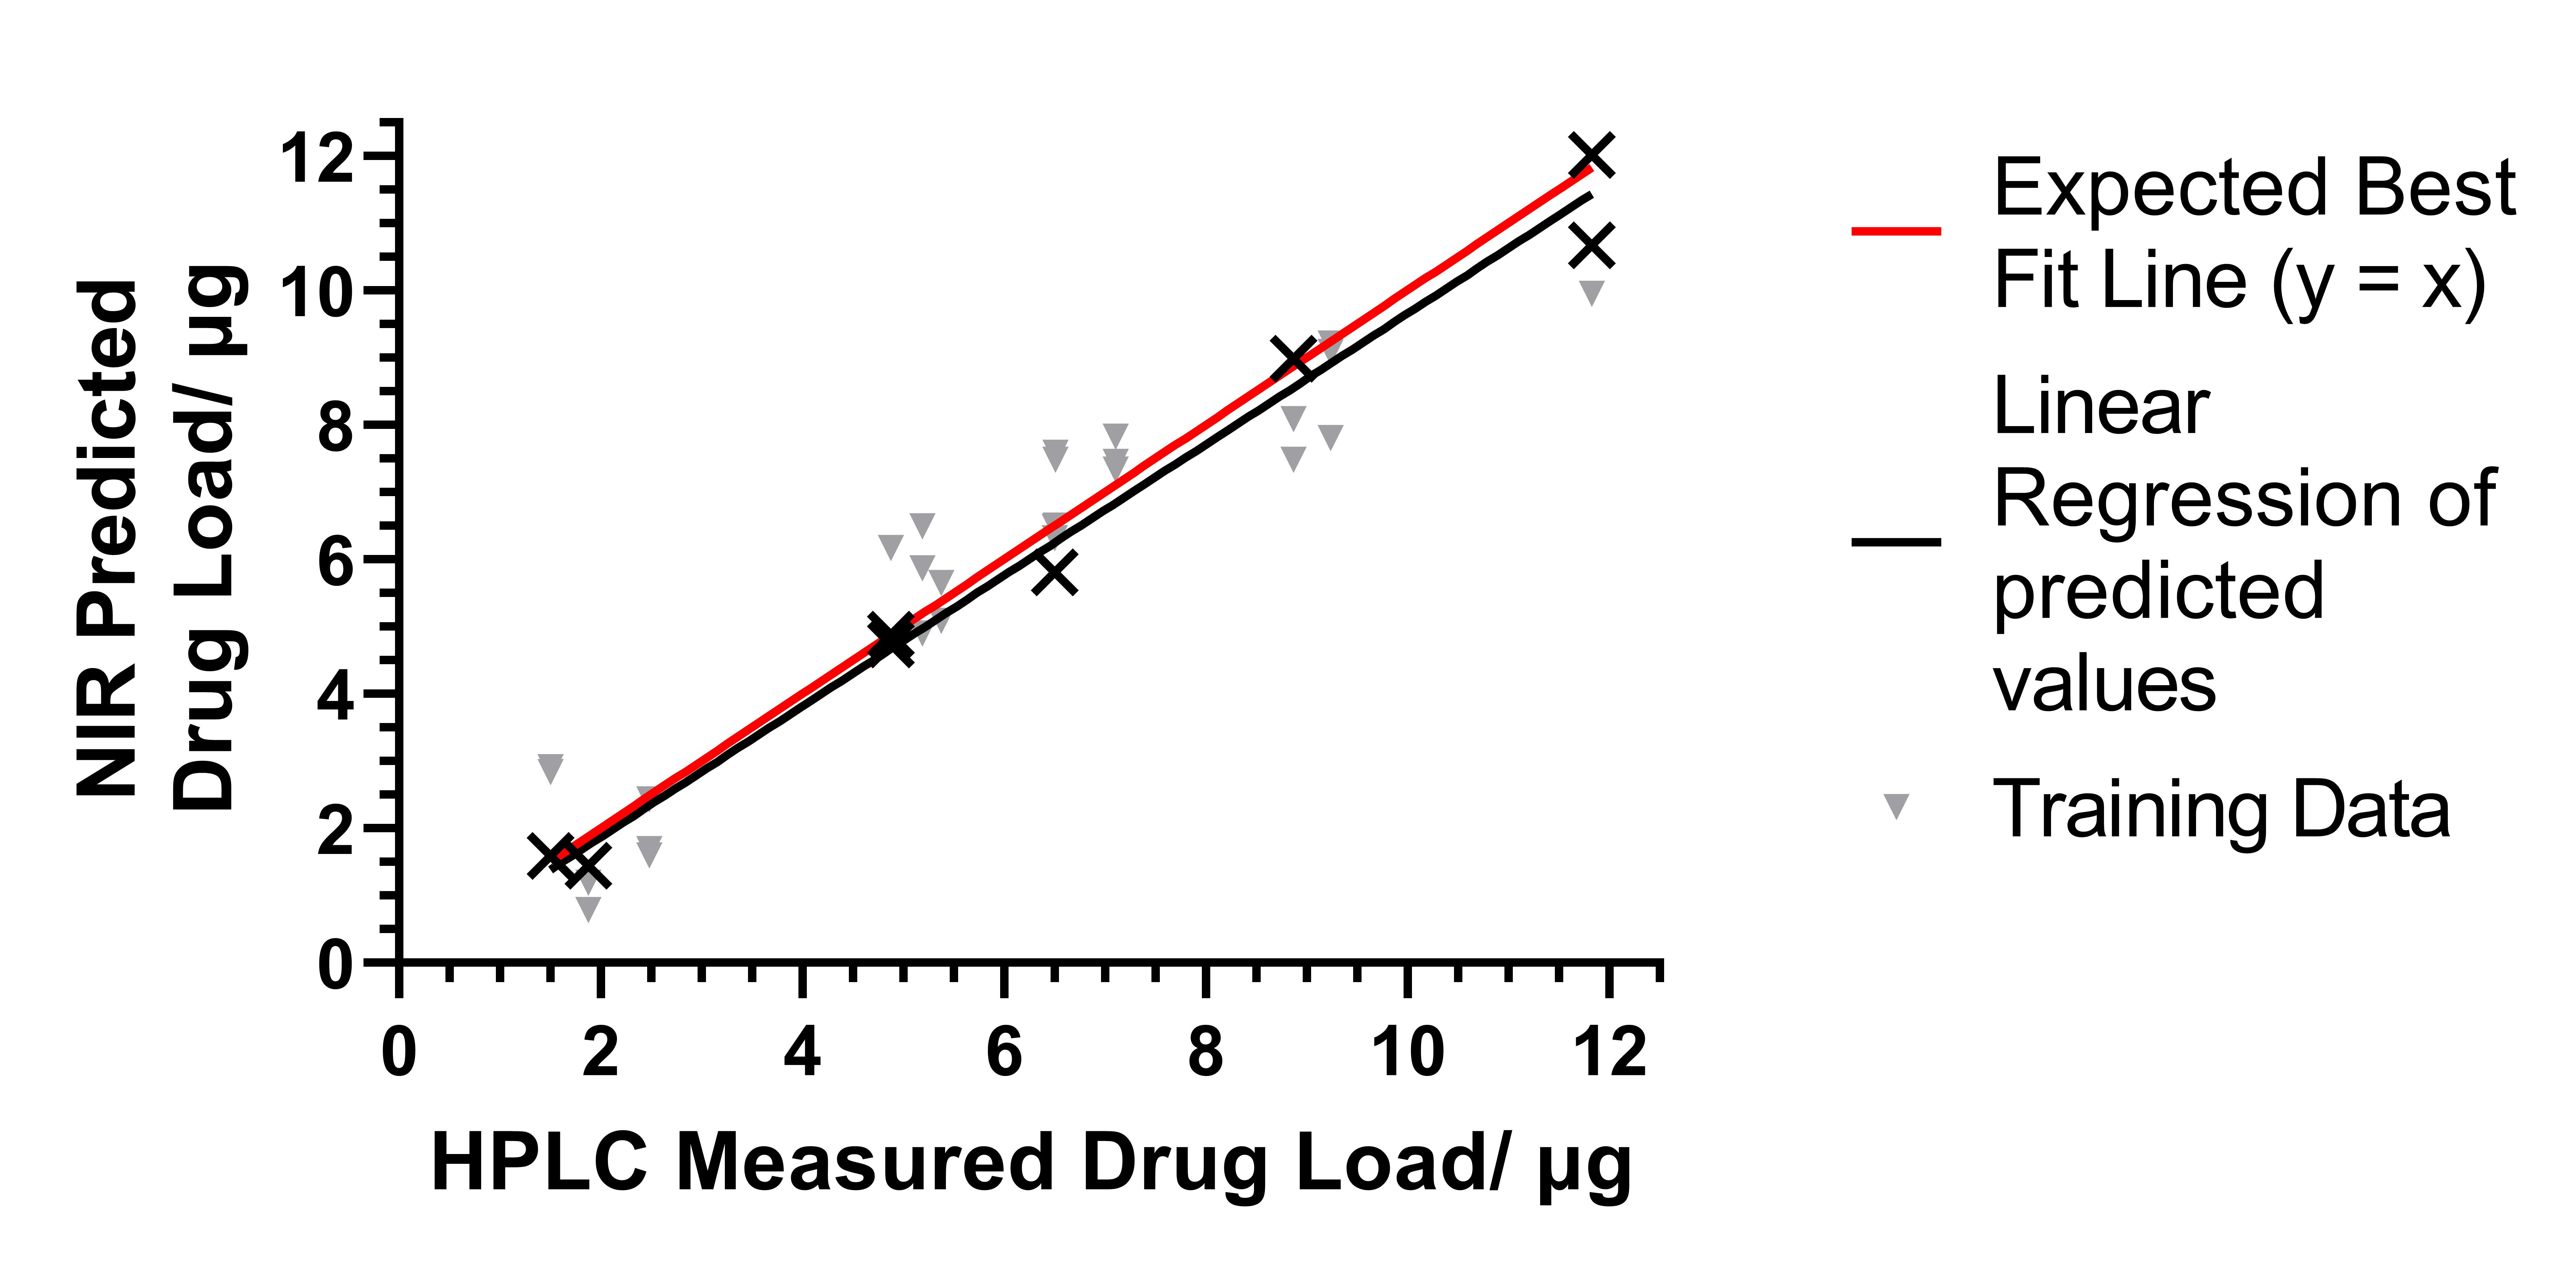 Figure 2. PLS model of NIR predicted vs. HPLC determined timolol content. The expected best fit line is for the actual concentration equal to the predicted concentration.
.jpg) Figure 3. Results from the in vitro dissolution study. Error bars are ± 1 standard deviation. A) Measurements of concentration collected over time with the drug printed on the inside face of the contact lens. Insert – plot with the concentration relative to the maximum concentration for the inside face dissolution. B) Measurements of drug concentration over time for drug printed on the outside face of the contact lens.
Figure 3. Results from the in vitro dissolution study. Error bars are ± 1 standard deviation. A) Measurements of concentration collected over time with the drug printed on the inside face of the contact lens. Insert – plot with the concentration relative to the maximum concentration for the inside face dissolution. B) Measurements of drug concentration over time for drug printed on the outside face of the contact lens.