
Formulation and Delivery - Chemical
Category: Poster Abstract
 photo")
Rahima Khatun, MS (she/her/hers)
Graduate Student
Duquesne University
Pittsburgh, Pennsylvania, United States
Rahima Khatun, MS (she/her/hers)
Graduate Student
Duquesne University
Pittsburgh, Pennsylvania, United States
Maegan G Miller, BS (she/her/hers)
Duquesne University
Irwin, Pennsylvania, United States
Ira S. Buckner, Ph.D. (he/him/his)
Duquesne University
Pittsburgh, Pennsylvania, United States
Peter L.D. Wildfong, Ph.D. (he/him/his)
Duquesne University
Pittsburgh, Pennsylvania, United States
.jpg) Figure 1: Graphical representation of the coefficient values for the intercept, solids content, atomization air pressure and interaction of the input variables.
Figure 1: Graphical representation of the coefficient values for the intercept, solids content, atomization air pressure and interaction of the input variables. 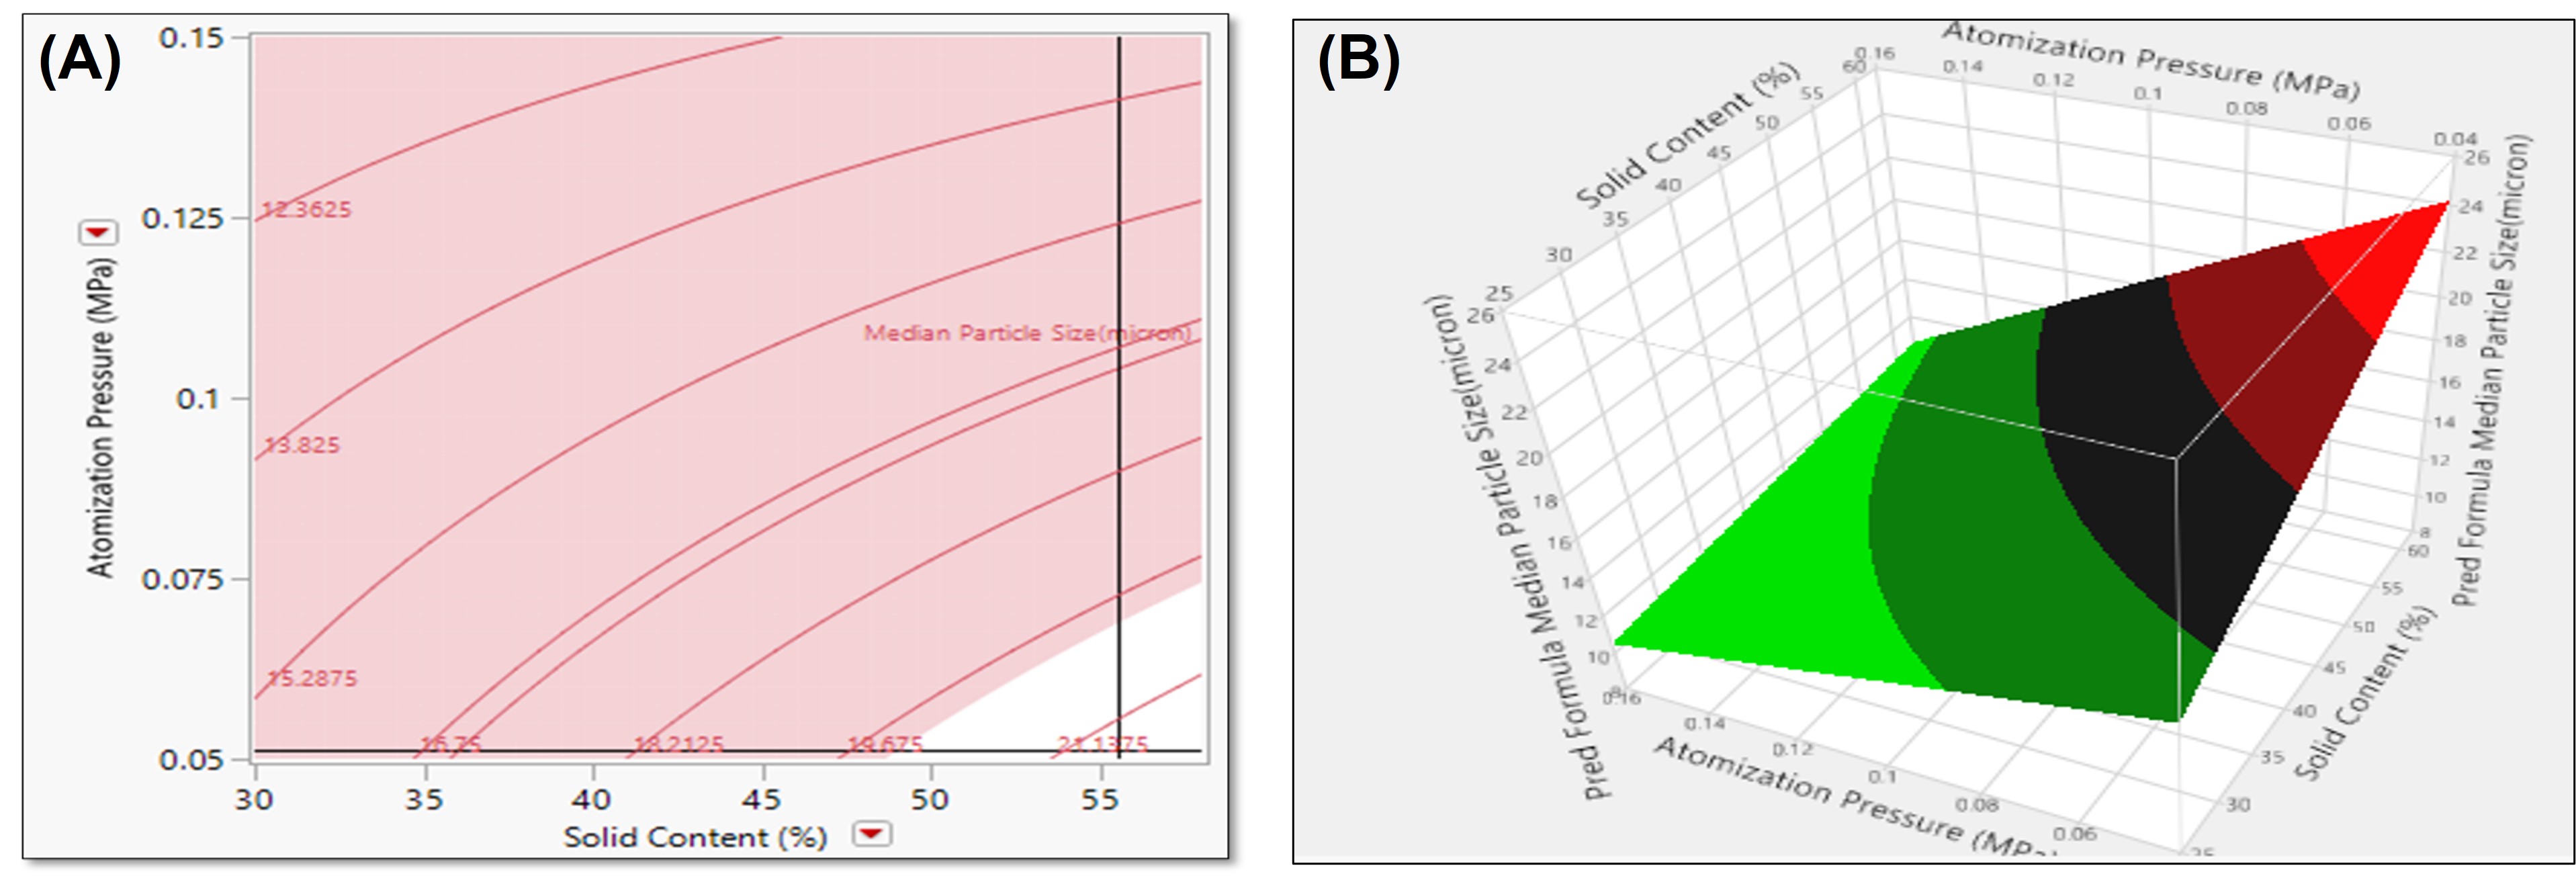 Figure 2: (A) Contour plot showing the unshaded region with a combination of upper level of solids content and lower level of atomization air pressure can result in microparticles with d50 above 20 µm and (B) surface plot of the response (median particle size) using full factorial design.
.jpg) Figure 3: Actual vs predicted plot showing relationship between solids content, atomization pressure and their interaction with the median particle size for PVP
Figure 3: Actual vs predicted plot showing relationship between solids content, atomization pressure and their interaction with the median particle size for PVP