
Formulation and Delivery - Chemical
Category: Poster Abstract
 photo")
Neeraj S. Thakur, PhD (he/him/his)
Postdoctoral Fellow
University of Oklahoma Health Sciences Center
Oklahoma City, Oklahoma, United States
Iulia Rus, BS (she/her/hers)
University of Oklahoma Health Sciences Center
Oklahoma City, Oklahoma, United States
Vibhuti Agrahari, Ph.D.
University of Oklahoma Health Sciences Center
Oklahoma City, Oklahoma, United States
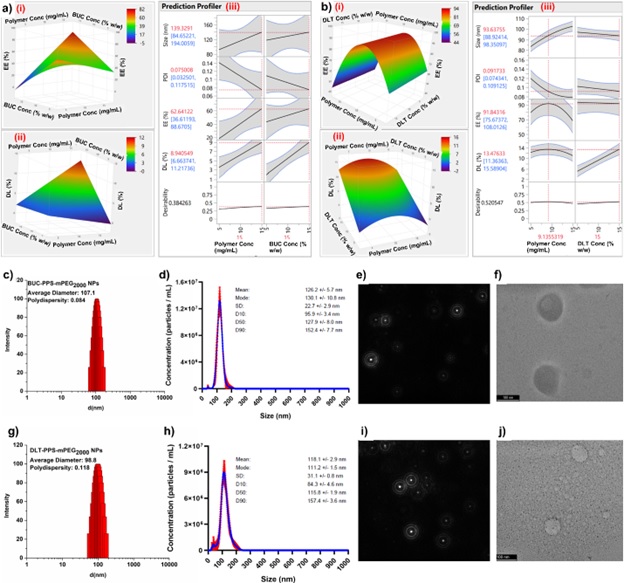 Figure 1 (a-b) DoE-CCD optimization graphs for the synthesis of (a) BUC-NCs and (b) DLT-NCs. The corresponding figures (i), (ii), and (iii), represent the encapsulation efficiency (EE%), Drug loading (DL %), and prediction profiler, respectively. (c-j) Size and morphology analysis of BUC-NCs and DLT-NCs. (c) Size distribution of BUC-NCs analyzed by DLS (d) Size distribution of BUC-NCs analyzed by NTA, (e) visual BUC-NCs under NTA Nanosight (f) TEM image of BUC-NCs showing spherical and intact shape (scale 100 nm). (g) Size distribution of DLT-NCs analyzed by DLS (h) Size distribution of DLT-NPs analyzed by NTA, (i) picture presenting the visual DLT-PPS-mPEG2000-NPs under NTA Nanosight , (j) TEM image of DLT-NCs showing spherical and intact shape (scale 100 nm).
 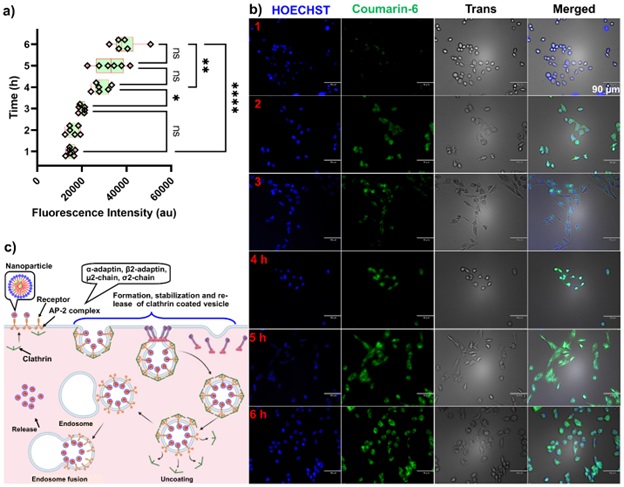 Figure 2 Cellular uptake and intracellular distribution study of NPs using C-6-PPS-mPEG2000-NCs. (a) Time required for significant cell internalization, (b) Fluorescence microscopy to confirm the cellular uptake and intracellular distribution, (c) Molecular mechanism of internalization. (The groups were compared using one-way ANOVA using Šidák’s multiple comparison post-hoc test. Asterisks: **** p < 0.0001; ** p≤ 0.005; * p≤ 0.05; ns= not significant)
.jpg) Figure 3. Characterization of NanoSensoGel formulation. The formulation’s sol state converts to gel state at/above 33 °C, while below 33°C the formulation remains in the sol state (a). At lower temperature, the gel is present in a flowing sol state while at a higher temperature the formulation components are arranged in the micellar structure and form a nonflowing gel state (b). SEM images (c i and c ii) of hydrogel were kept below 30 °C at sol state then snap-freeze using liquid nitrogen at -196 °C and lyophilized subsequently. The sample observed under the SEM shows the un-arranged pattern in the structure (scale 10 µm). (c iii and c iv) SEM images of hydrogel were kept at 34 °C gel state then snap-freeze and lyophilized subsequently. The sample observed under the SEM showed a well-arranged honeycomb-type pattern in the structure (scale 10 µm). (d) ‘i’; the pictorial representation of well-insert that was used for the drug release study from the hydrogel. ‘ii’; the pictures captured after setting up the release experiments. (e) Graphs ‘i and ii’ are showing the percent release of BUC and DLT from NanoSensoGel and free BUC/DLT-Gel, respectively. (f) The graph showing the cytoprotective effect of NanoSensoGel compared with free BUC/DLT-Gel, free BUC/DLT-PPS-mPEG2000-NPs, and free BUC/DLT solution after the cell (HEI-OC1) exposed to CisPt.
Figure 3. Characterization of NanoSensoGel formulation. The formulation’s sol state converts to gel state at/above 33 °C, while below 33°C the formulation remains in the sol state (a). At lower temperature, the gel is present in a flowing sol state while at a higher temperature the formulation components are arranged in the micellar structure and form a nonflowing gel state (b). SEM images (c i and c ii) of hydrogel were kept below 30 °C at sol state then snap-freeze using liquid nitrogen at -196 °C and lyophilized subsequently. The sample observed under the SEM shows the un-arranged pattern in the structure (scale 10 µm). (c iii and c iv) SEM images of hydrogel were kept at 34 °C gel state then snap-freeze and lyophilized subsequently. The sample observed under the SEM showed a well-arranged honeycomb-type pattern in the structure (scale 10 µm). (d) ‘i’; the pictorial representation of well-insert that was used for the drug release study from the hydrogel. ‘ii’; the pictures captured after setting up the release experiments. (e) Graphs ‘i and ii’ are showing the percent release of BUC and DLT from NanoSensoGel and free BUC/DLT-Gel, respectively. (f) The graph showing the cytoprotective effect of NanoSensoGel compared with free BUC/DLT-Gel, free BUC/DLT-PPS-mPEG2000-NPs, and free BUC/DLT solution after the cell (HEI-OC1) exposed to CisPt.