
Manufacturing and Analytical Characterization - Chemical
Category: Late Breaking Poster Abstract

Cristian Kulcitki
Doctoral Candidate
University of Hamburg
Hamburg, Hamburg, Germany
Cristian Kulcitki
Doctoral Candidate
University of Hamburg
Hamburg, Hamburg, Germany
Anna Novikova
Fette Compacting GmbH
Schwarzenbek, Schleswig-Holstein, Germany
Markus Krumme
Novartis Pharma AG
Basel, Basel-Stadt, Switzerland
Claudia Leopold
University of Hamburg
Hamburg, Hamburg, Germany
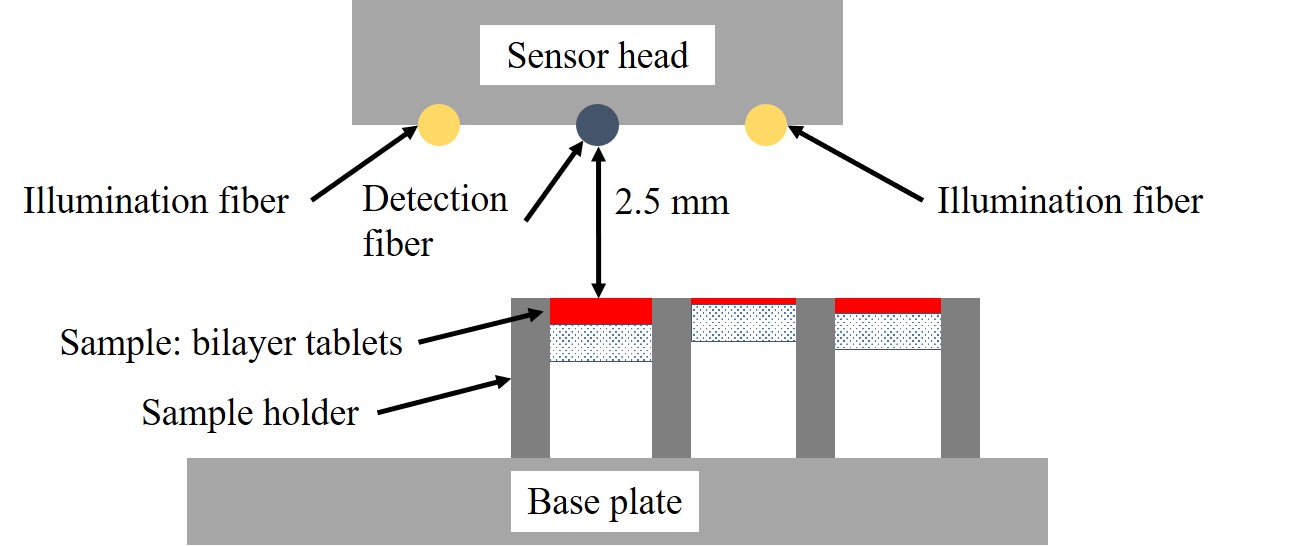 Figure 1: Experimental setup: top layer with variable thickness represented as red rectangles; bottom PTFE layer represented as dotted rectangles.
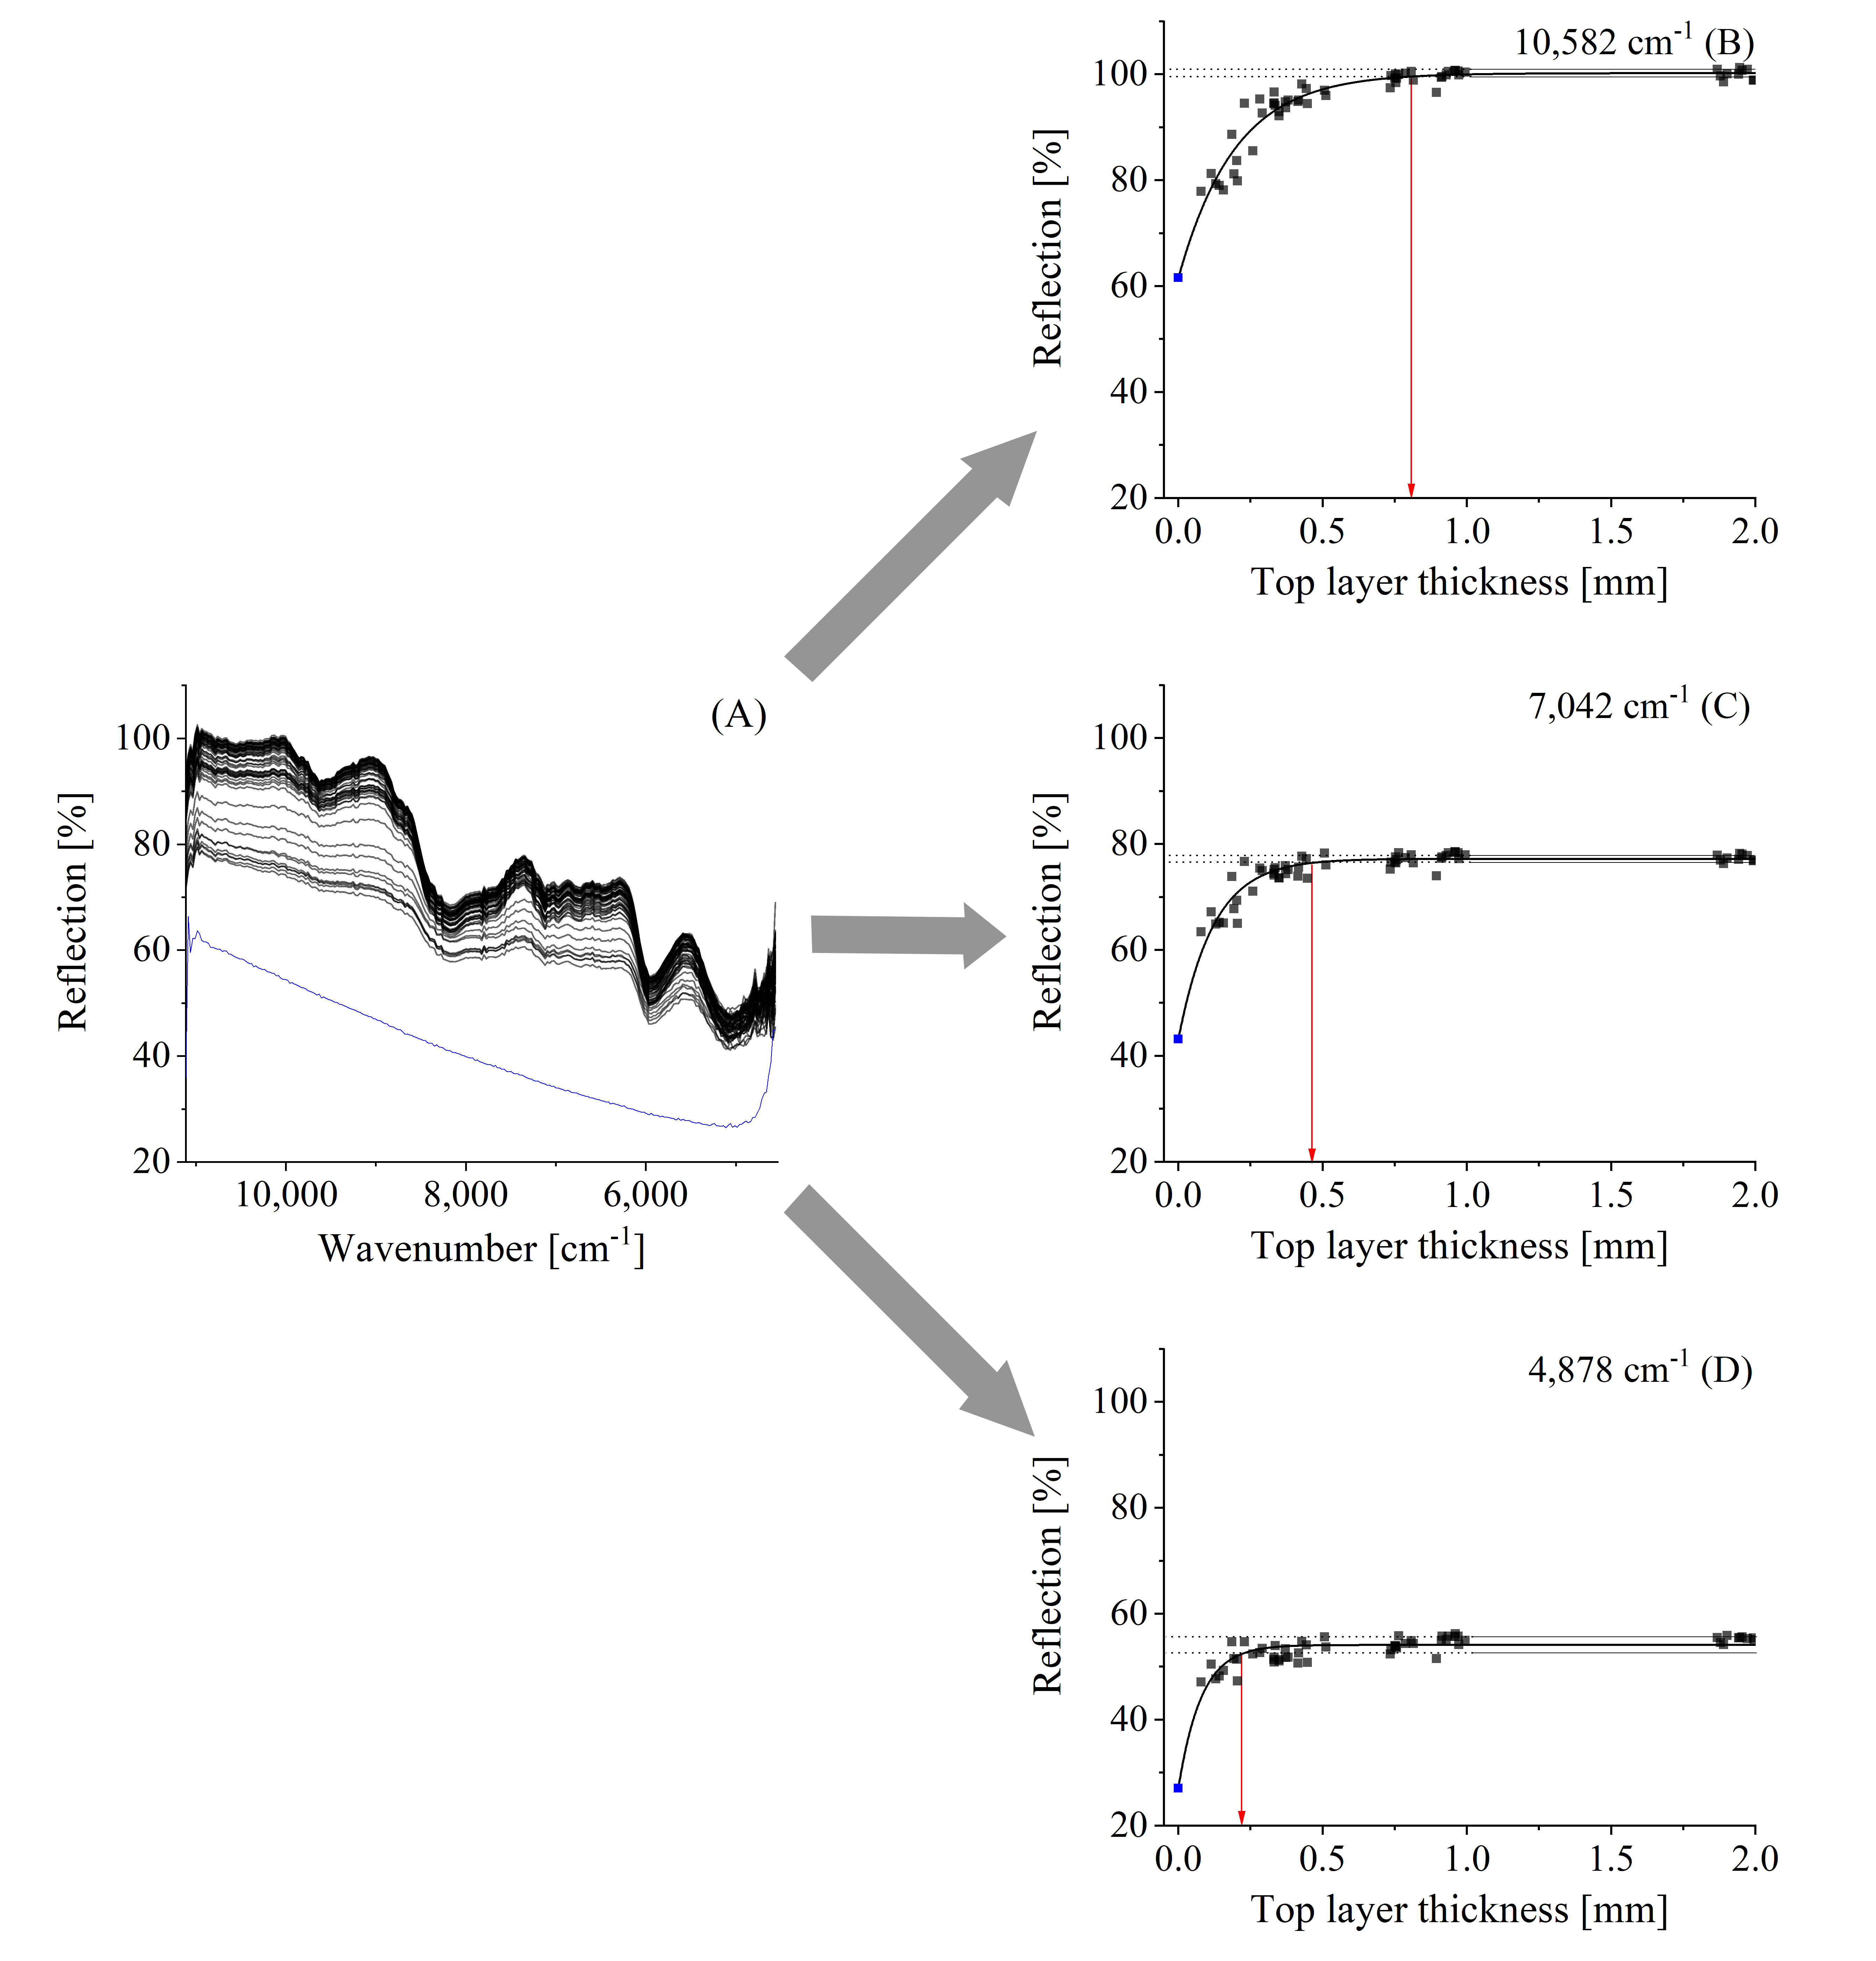 Figure 2: Reflection spectra of the bilayer tablets (n = 59) with top layers of different thicknesses (A) and the corresponding reflection intensity profiles at different wavenumbers (B-D). The blue line and the blue squares, respectively, represent the reflection spectrum or reflection values of the interface. The red arrows point to the abscissa values of the intersection point between the asymptotic curve and the extrapolated confidence interval, which was considered as the sampling depth.
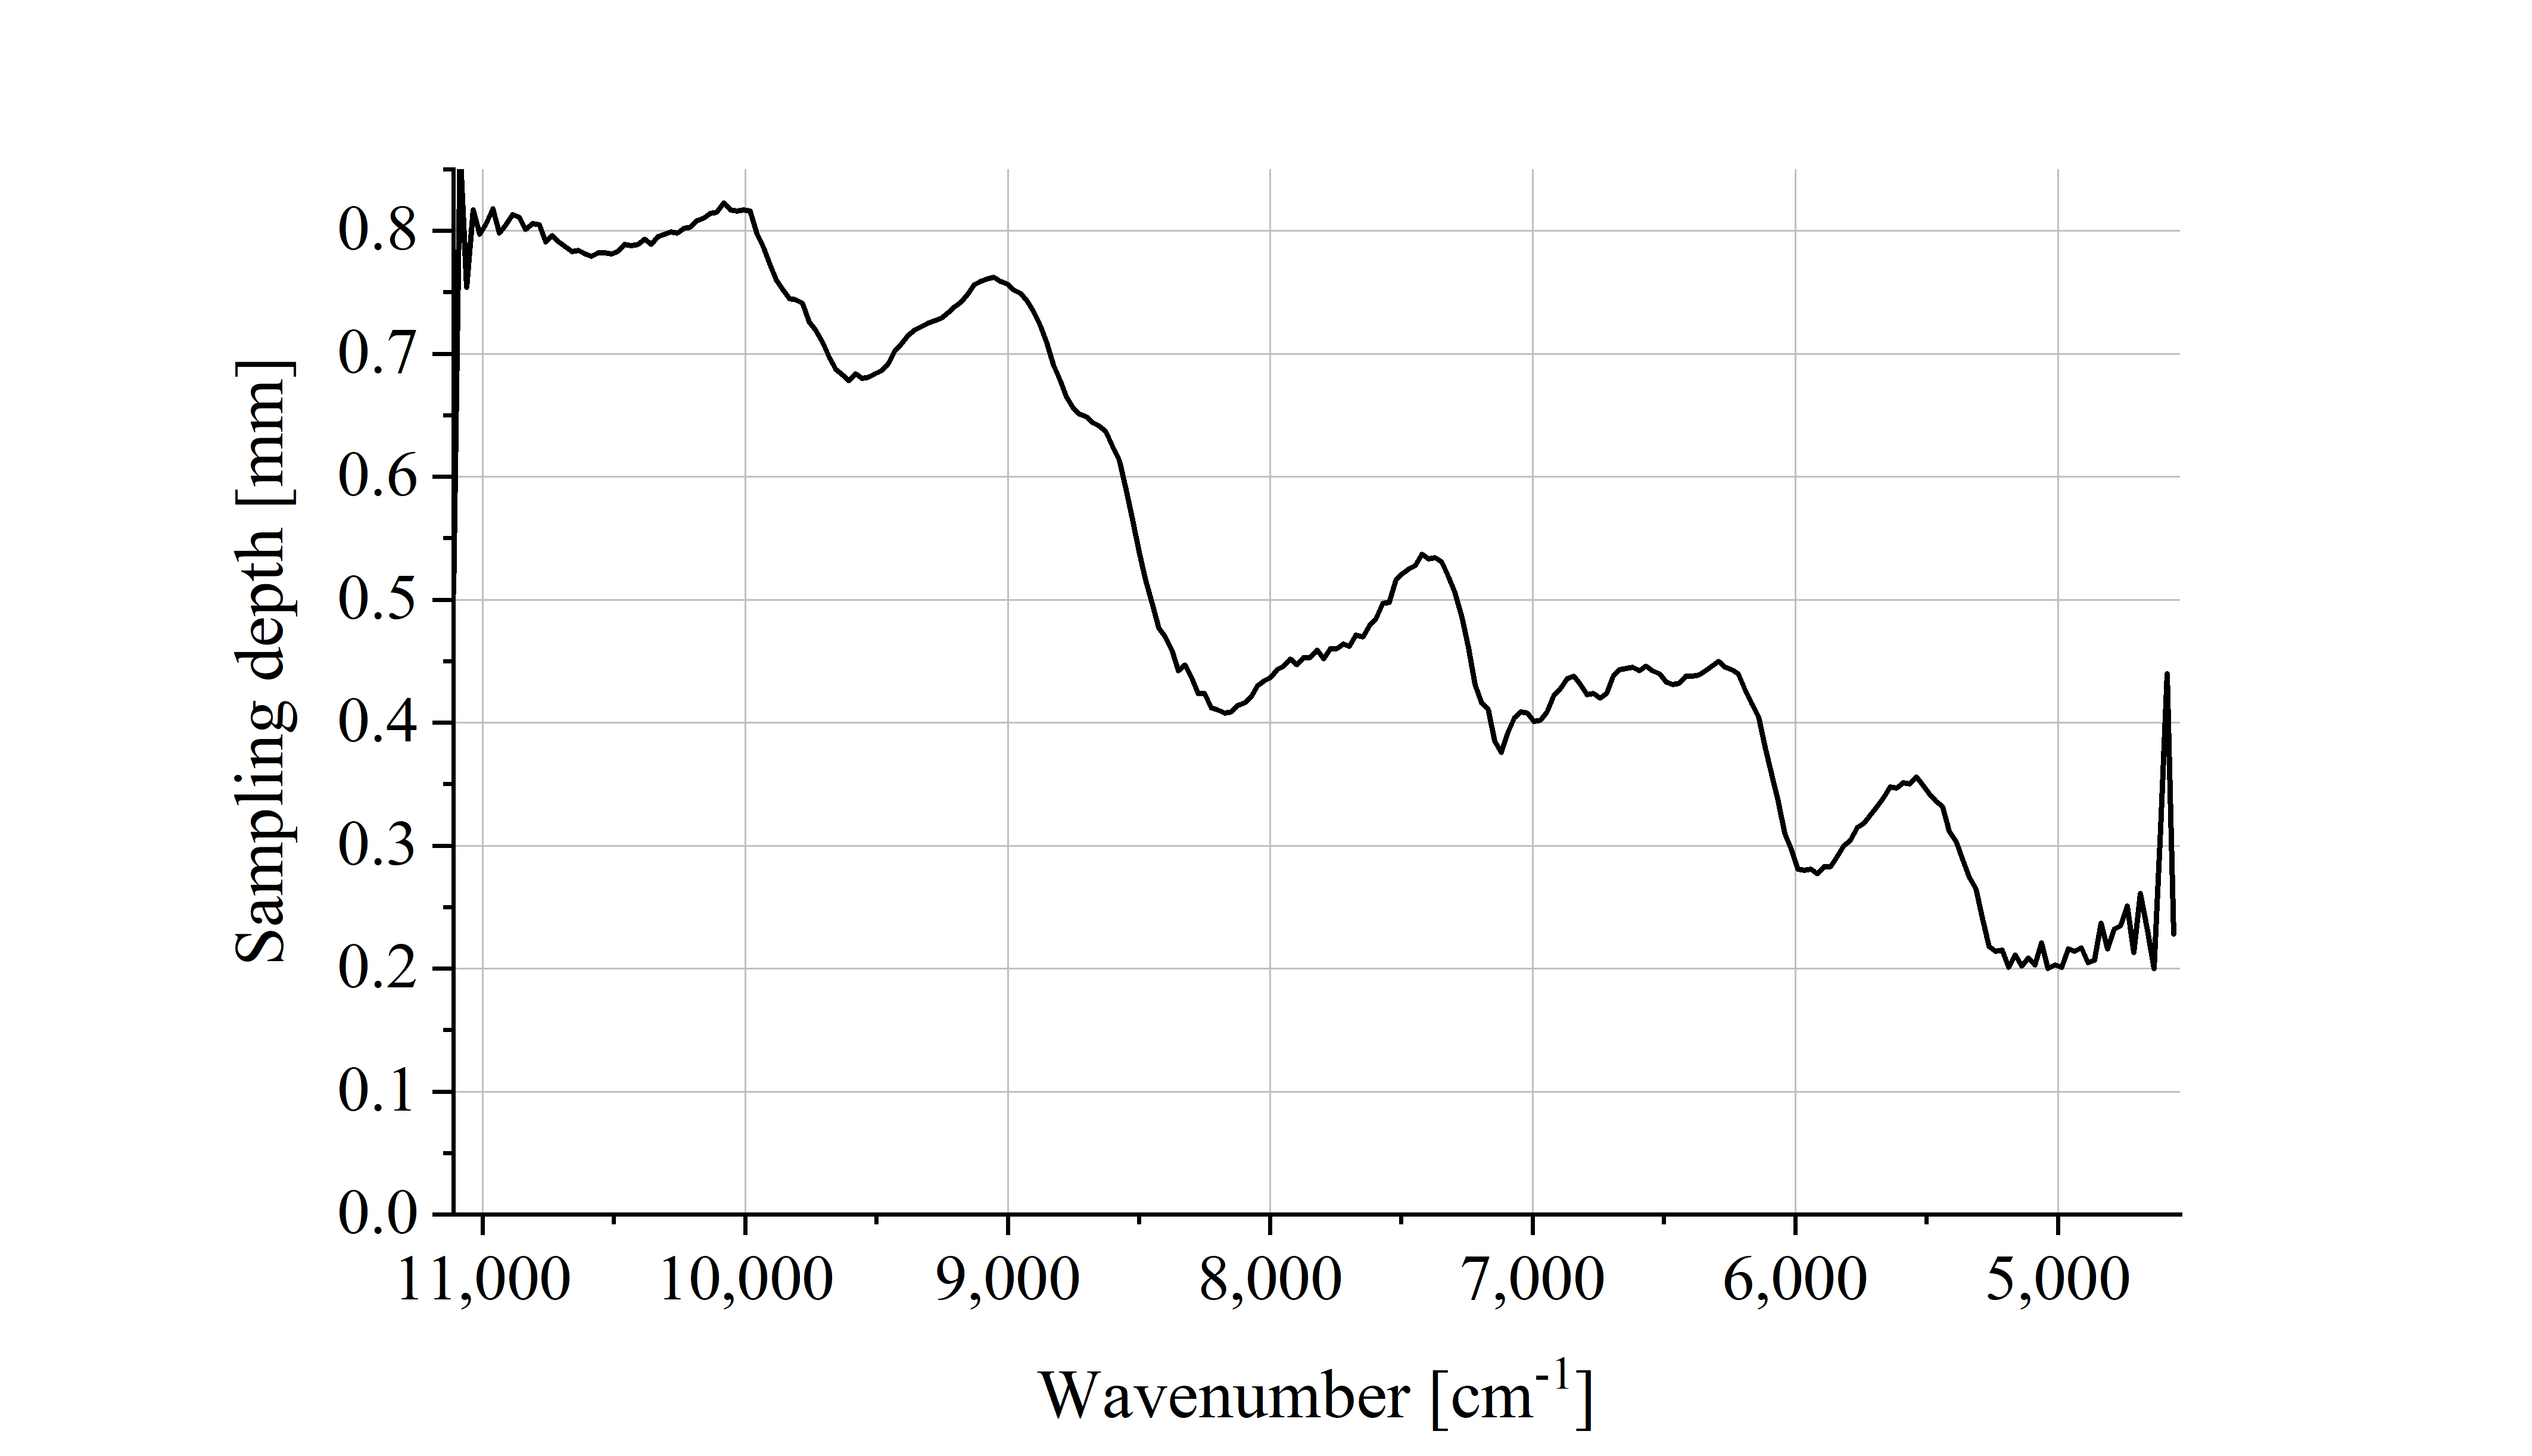 Figure 3: Sampling depth profile of the novel in-line reflection NIR sensor.