Discovery and Basic Research
Category: Late Breaking Poster Abstract
(M1130-05-30) A Robust, Viable, and Resource Sparing HPLC-Based logP Method Applied to Common Drugs

Ana Coutinho, Pharm.D. (she/her/hers)
PhD Candidate
University of Maryland Baltimore
Baltimore, Maryland, United States
Ana Coutinho, Pharm.D. (she/her/hers)
PhD Candidate
University of Maryland Baltimore
Baltimore, Maryland, United States- RC
Rodrigo Cristofoletti, Ph.D. (he/him/his)
University of Florida
Orlando, Florida, United States - JD
Jennifer Dressman, Ph.D. (she/her/hers)
Fraunhofer Institute for Translational Medicine and Pharmacology
Frankfurt am Main, Hessen, Germany - JP
James Polli, Ph.D. (he/him/his)
University of Maryland
baltimore, Maryland, United States
Presenting Author(s)
Main Author(s)
Co-Author(s)
Purpose: Reliable partition coefficient P (logP) values are important for medicinal chemistry assessment, and future solubility, dissolution, PK and PD modeling. However, reliable experimental logP values are often unavailable in the literature. The shake-flask and slow-stirring methods are commonly used to determine logP experimentally. However, they are labor intensive and hard to adapt to a high throughput approach. On the other hand, reverse-phase high performance liquid chromatography (RP-HPLC) methods are recommended by the Organization for Economic Co-operation and Development (OECD), only require a minimal quantity of material and can be easily automated. This study measured the logP of twelve common drugs using an RP-HPLC-based method that is time and resource sparing, with the goal of promoting more frequent reporting of experimental logP in the literature.
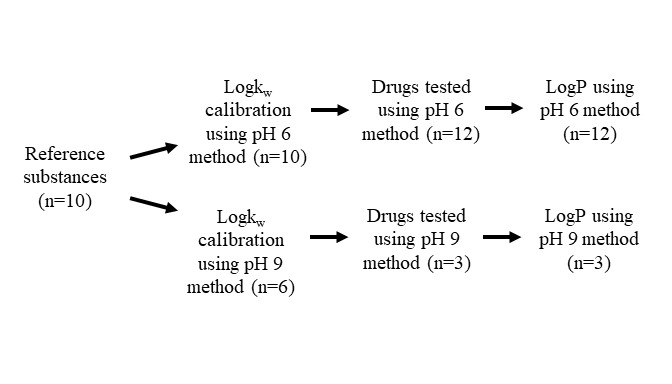
Methods: Ten reference substances were selected from the OECD 2004 Guideline Test No 117. Twelve test drugs from BCS class I, II, and IV were subjected to logP measurement (Table 1). RP-HPLC measurements were performed on a Waters AcquityH Class UPLC system controlled by Empower 3 Software version (Waters Corporation). Retention times were measured using the Poroshell 120 EC-C18 (4.6 x 150 mm, 4 mm, Agilent Technologies) column at 30 °C, with flow rate of 1 mL/min, and injection volume of 2 uL. Photodiode-array detection was set to 200-700 nm. LogP was derived from the compound’s retention factor (k). For each reference substance and test drug, retention factor was calculated from the retention time (Equation 1) in 20 mM sodium acetate buffer (pH 6) and methanol, as well as 20 mM ammonium formate buffer (pH 9) and methanol. Retention factor was determined for the reference substances and test drugs according to Equation 1. The retention time of uracil (i.e. unretained compound) is denoted T0. Using the log of retention time (logk) at 100% water (i.e. logkw), logP can be calculated from Equation 2. Since most compounds are too lipophilic to use 100% water as mobile phase, extrapolated values of logk were obtained using mobile phase at various methanol percentages. Equation 3 expresses the dependence of logk on the proportion of organic modifier (j). For example, when φ=0, logk equals logkw. For each reference substance and test drug, at least five methanol percentages were tested (j= 40-90%). The extrapolated logkw and logP were calculated using GraphPad Prism version 9.3.1. The logkw and logP of ten drugs and six reference substances were used in the calibration curves at pH 6 and 9, respectively. Robustness of the HPLC-based logP method was assessed via inspection of intermediate logkw, leave-one-out analysis, and pH effect. HPLC-based logP values were compared against literature values.(1) k = (Tr - T0)/ T0
(2) logP = a * logkw + b
(3) logk = logkw - S * φ
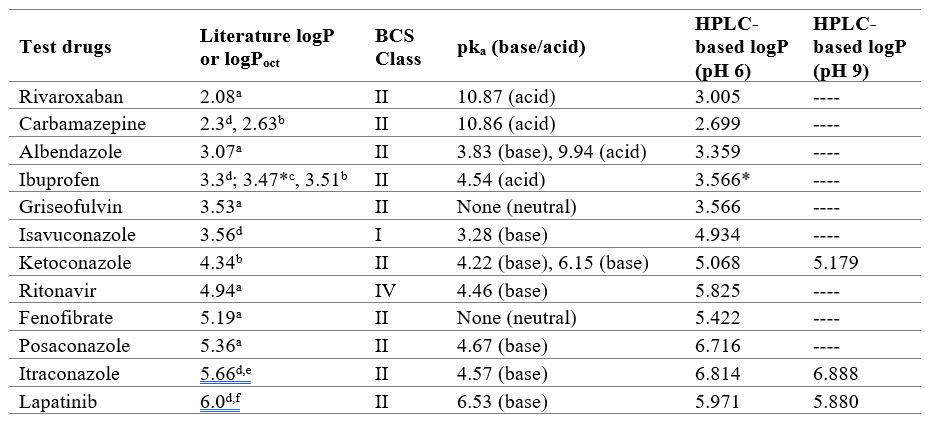
Results: Logkw values generated in this study were within the range of logkw values found in other studies. Reference substances at pH 6 and 9 yielded linear calibration curves with R2 >0.99 and standard deviation of the residuals close to zero. Both models were linear and passed the goodness-of-fit assessment, while neither calibration curve was overly sensitive to any one reference substance. Calibration curves were applied to determine test drug logP at the two pH conditions. Measured logP from our HPLC-based method are compared with literature values in Table 1. For weak acids and neutral drugs, the experimental logP value was close to or a little higher than the literature value, while for the weak bases the experimental logP value trended higher than the literature value. A propensity for larger differences between HPLC-based logP here and literature logP for higher molecular weight drugs was also observed. LogP results for the three drugs studied at both pH 6 and 9 (ketoconazole, itraconazole, and lapatinib) were similar at both pH values.
Conclusion: Six of the twelve test drugs showed HPLC-based logP values similar (within 10%) to the literature logP, noting that many literature values are in silico derived rather than experimental. There was good general agreement with the few other HPLC-based literature logP values available. Since the HPLC-based method is easy and robust, it can be used more frequently to measure and report logP values for drug substances.
Acknowledgements: This work was supported by the Food and Drug Administration. Figure 1- Scope of studies to measure HPLC-based drug logP at pH 6 and 9. There were ten reference substances applied to logP at pH 6. LogP at pH 9 was assessed for ketoconazole and lapatinib since they were modestly ionized at pH 6. Itraconazole was also analyzed at pH 9. Four reference substances were excluded from the pH 9 HPLC method since their logP values were much less than the literature logP of ketoconazole, lapatinib, and itraconazole.
 Table 1 - LogP values of twelve test drugs. Literature logP values involved computer calculation and/or experimental tests. HPLC-based logP here tended to be higher than literature logP and in silico predictions. Literature logP methods: (a) in silico; (b) HPLC; (c) Thin-layer chromatography; (d) Shake-flask or slow-stirring method; (e) US FDA package insert; (f) US FDA review documents. (*) molecular ionization > 90%.
