
Formulation and Delivery - Chemical
Category: Poster Abstract
Wenhao Wang, MS (he/him/his)
Sun Yat-Sen University
Guangzhou, Guangdong, China (People's Republic)
Wenhao Wang, MS (he/him/his)
Sun Yat-Sen University
Guangzhou, Guangdong, China (People's Republic)
Wenhao Wang, MS (he/him/his)
Sun Yat-Sen University
Guangzhou, Guangdong, China (People's Republic)
Ziqiao Zhong, BS (he/him/his)
Jinan University
Guangzhou, Guangdong, China (People's Republic)
Zhengwei Huang, Ph.D. (he/him/his)
Jinan University
Guangzhou, Guangdong, China (People's Republic)
Ying Huang, Ph.D. (she/her/hers)
Jinan University
Guangzhou, Guangdong, China (People's Republic)
Chuanbin Wu, Ph.D. (he/him/his)
Jinan University
Guangzhou, Guangdong, China (People's Republic)
Xin Pan, Ph.D. (she/her/hers)
Sun Yat-Sen University
Guangzhou, Guangdong, China (People's Republic)
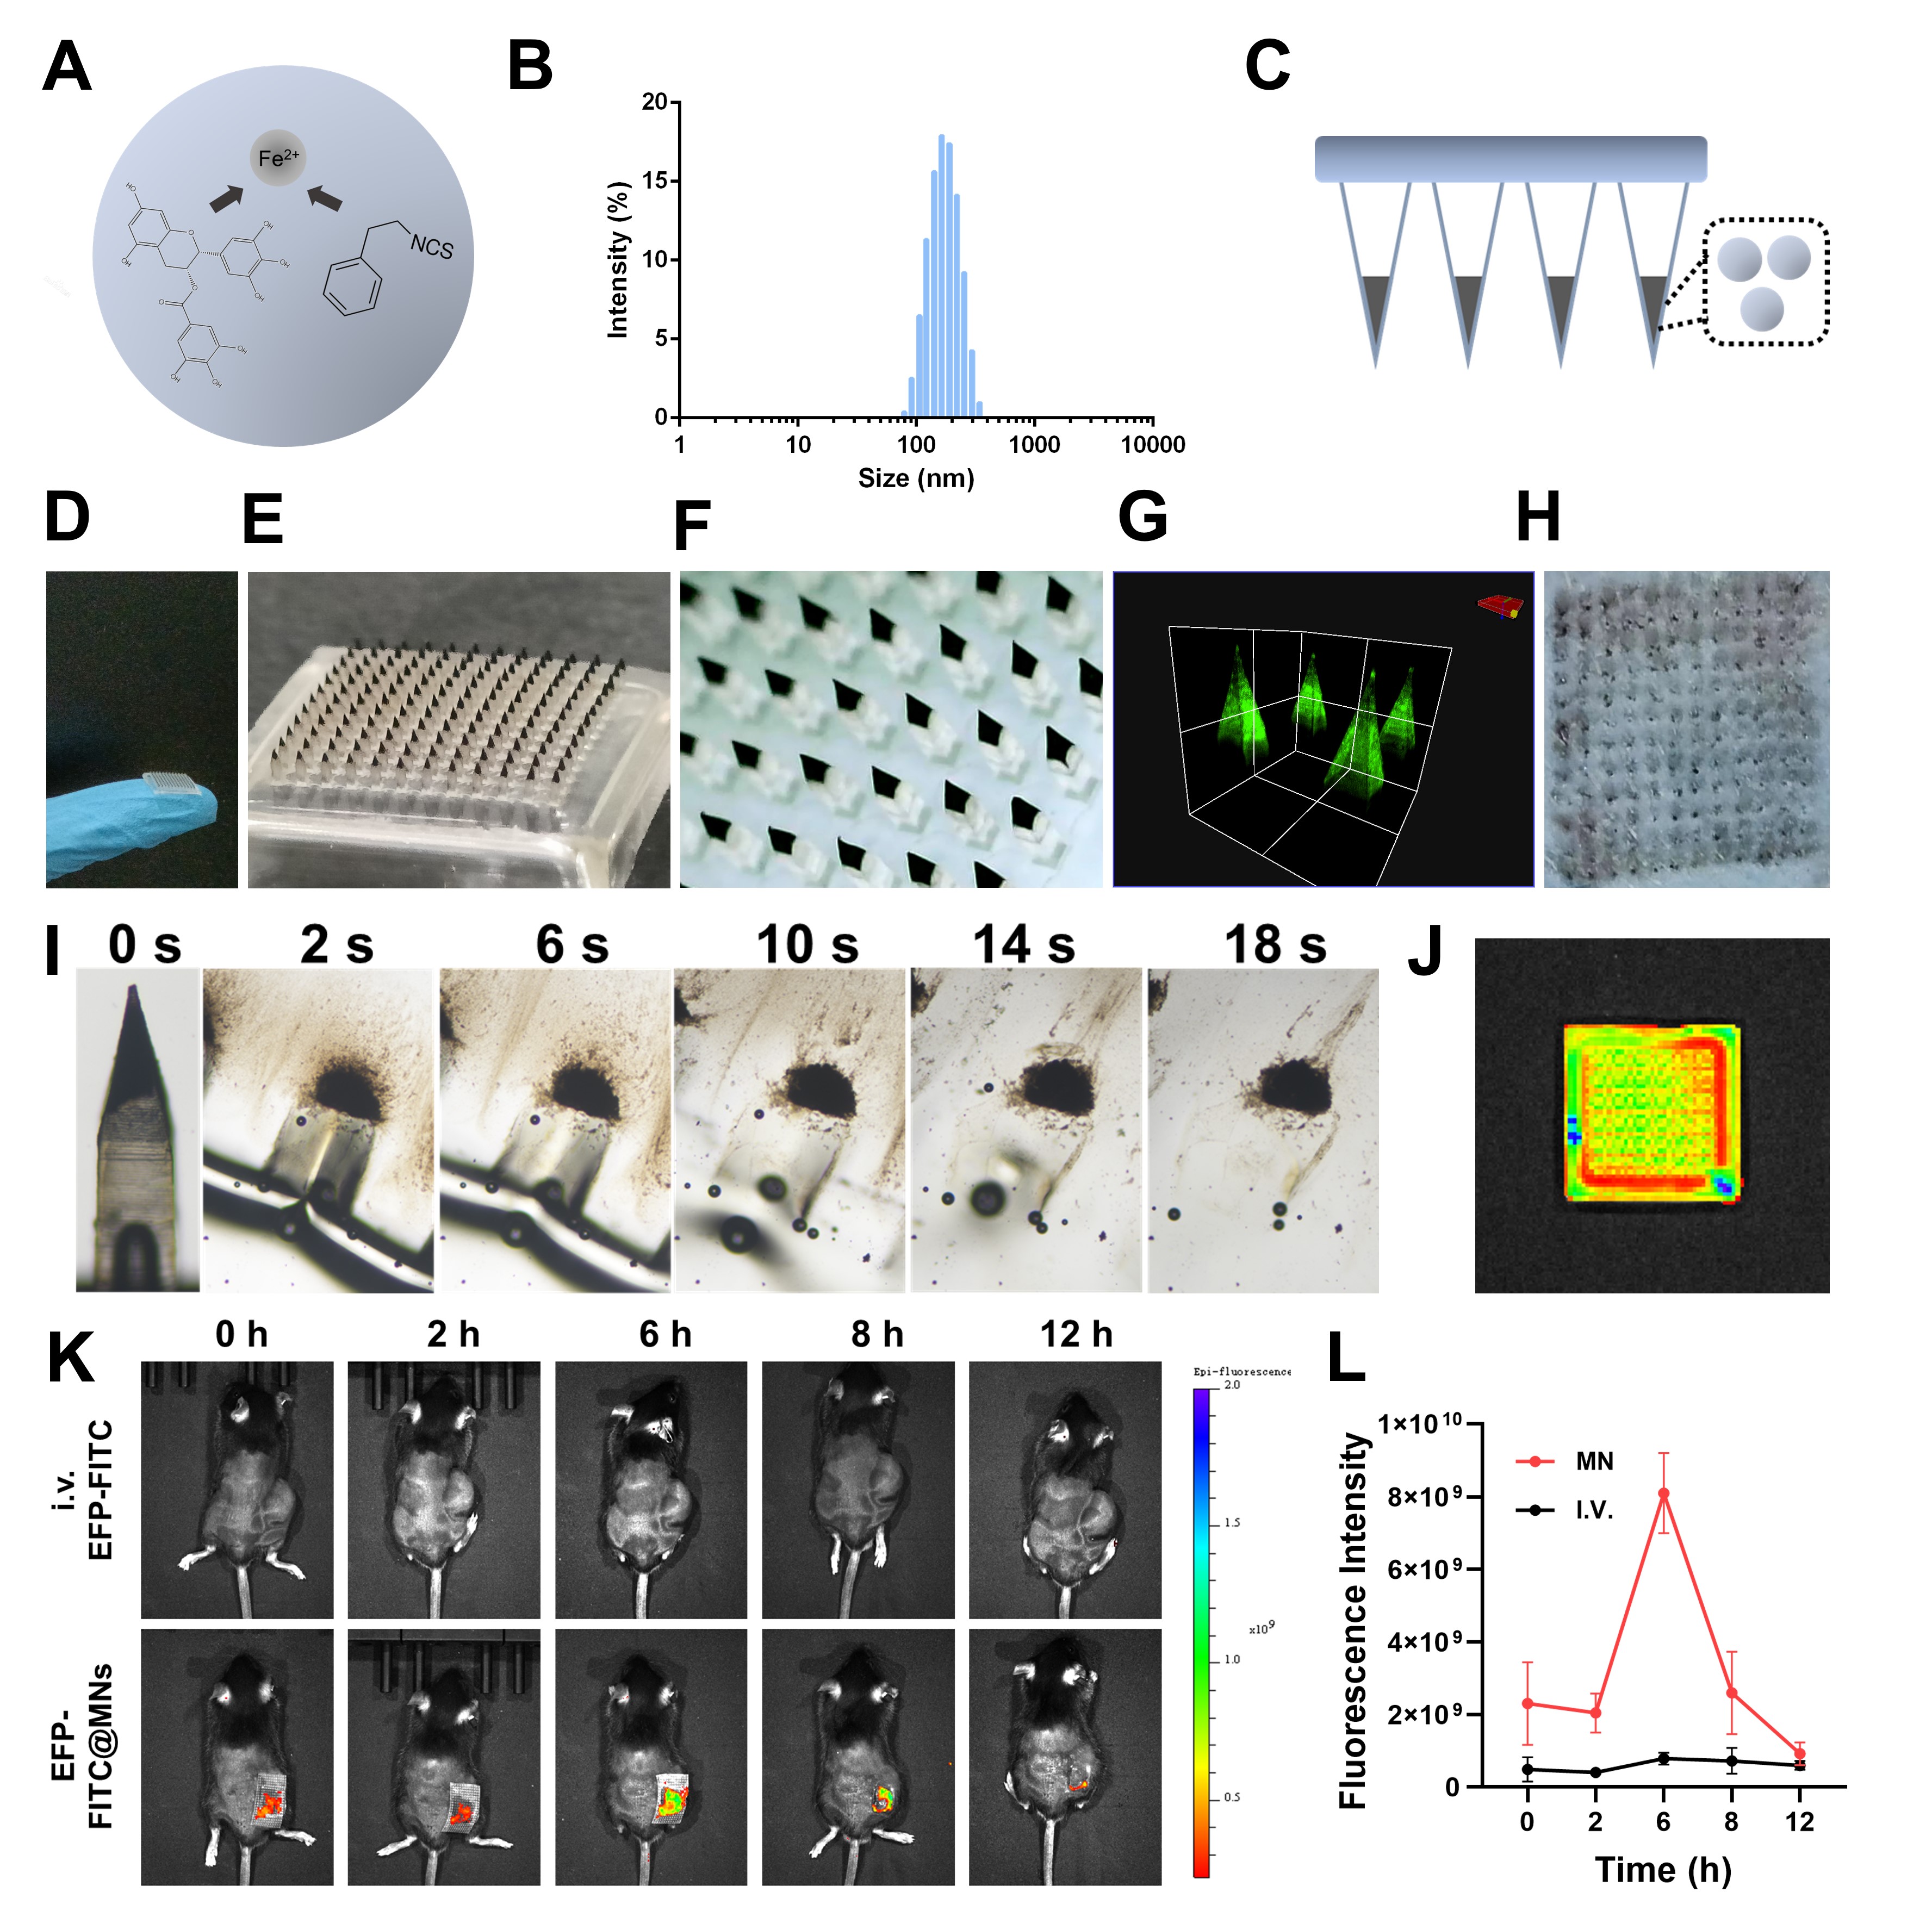 Figure 1. The preparation and characterization of EFP@MNs: (A) Schematical illustration of EFP nanocomposite. (B) The particle size distribution of EFP nanocomposite. (C) Schematical illustration of EFP@MNs. (D-F) The appearance and morphology of EFP@MNs. (G) CLSM images of a FITC-labeled microneedle patch. (H) The EFP@MNs insertion images of mice skin. (I) The water dissolving images of EFP@MNs. (J) Fluorescence images of FITC-labeled microneedle patch. (K-L) In vivo distribution of EFP-FITC in B16-tumor-bearing mice.
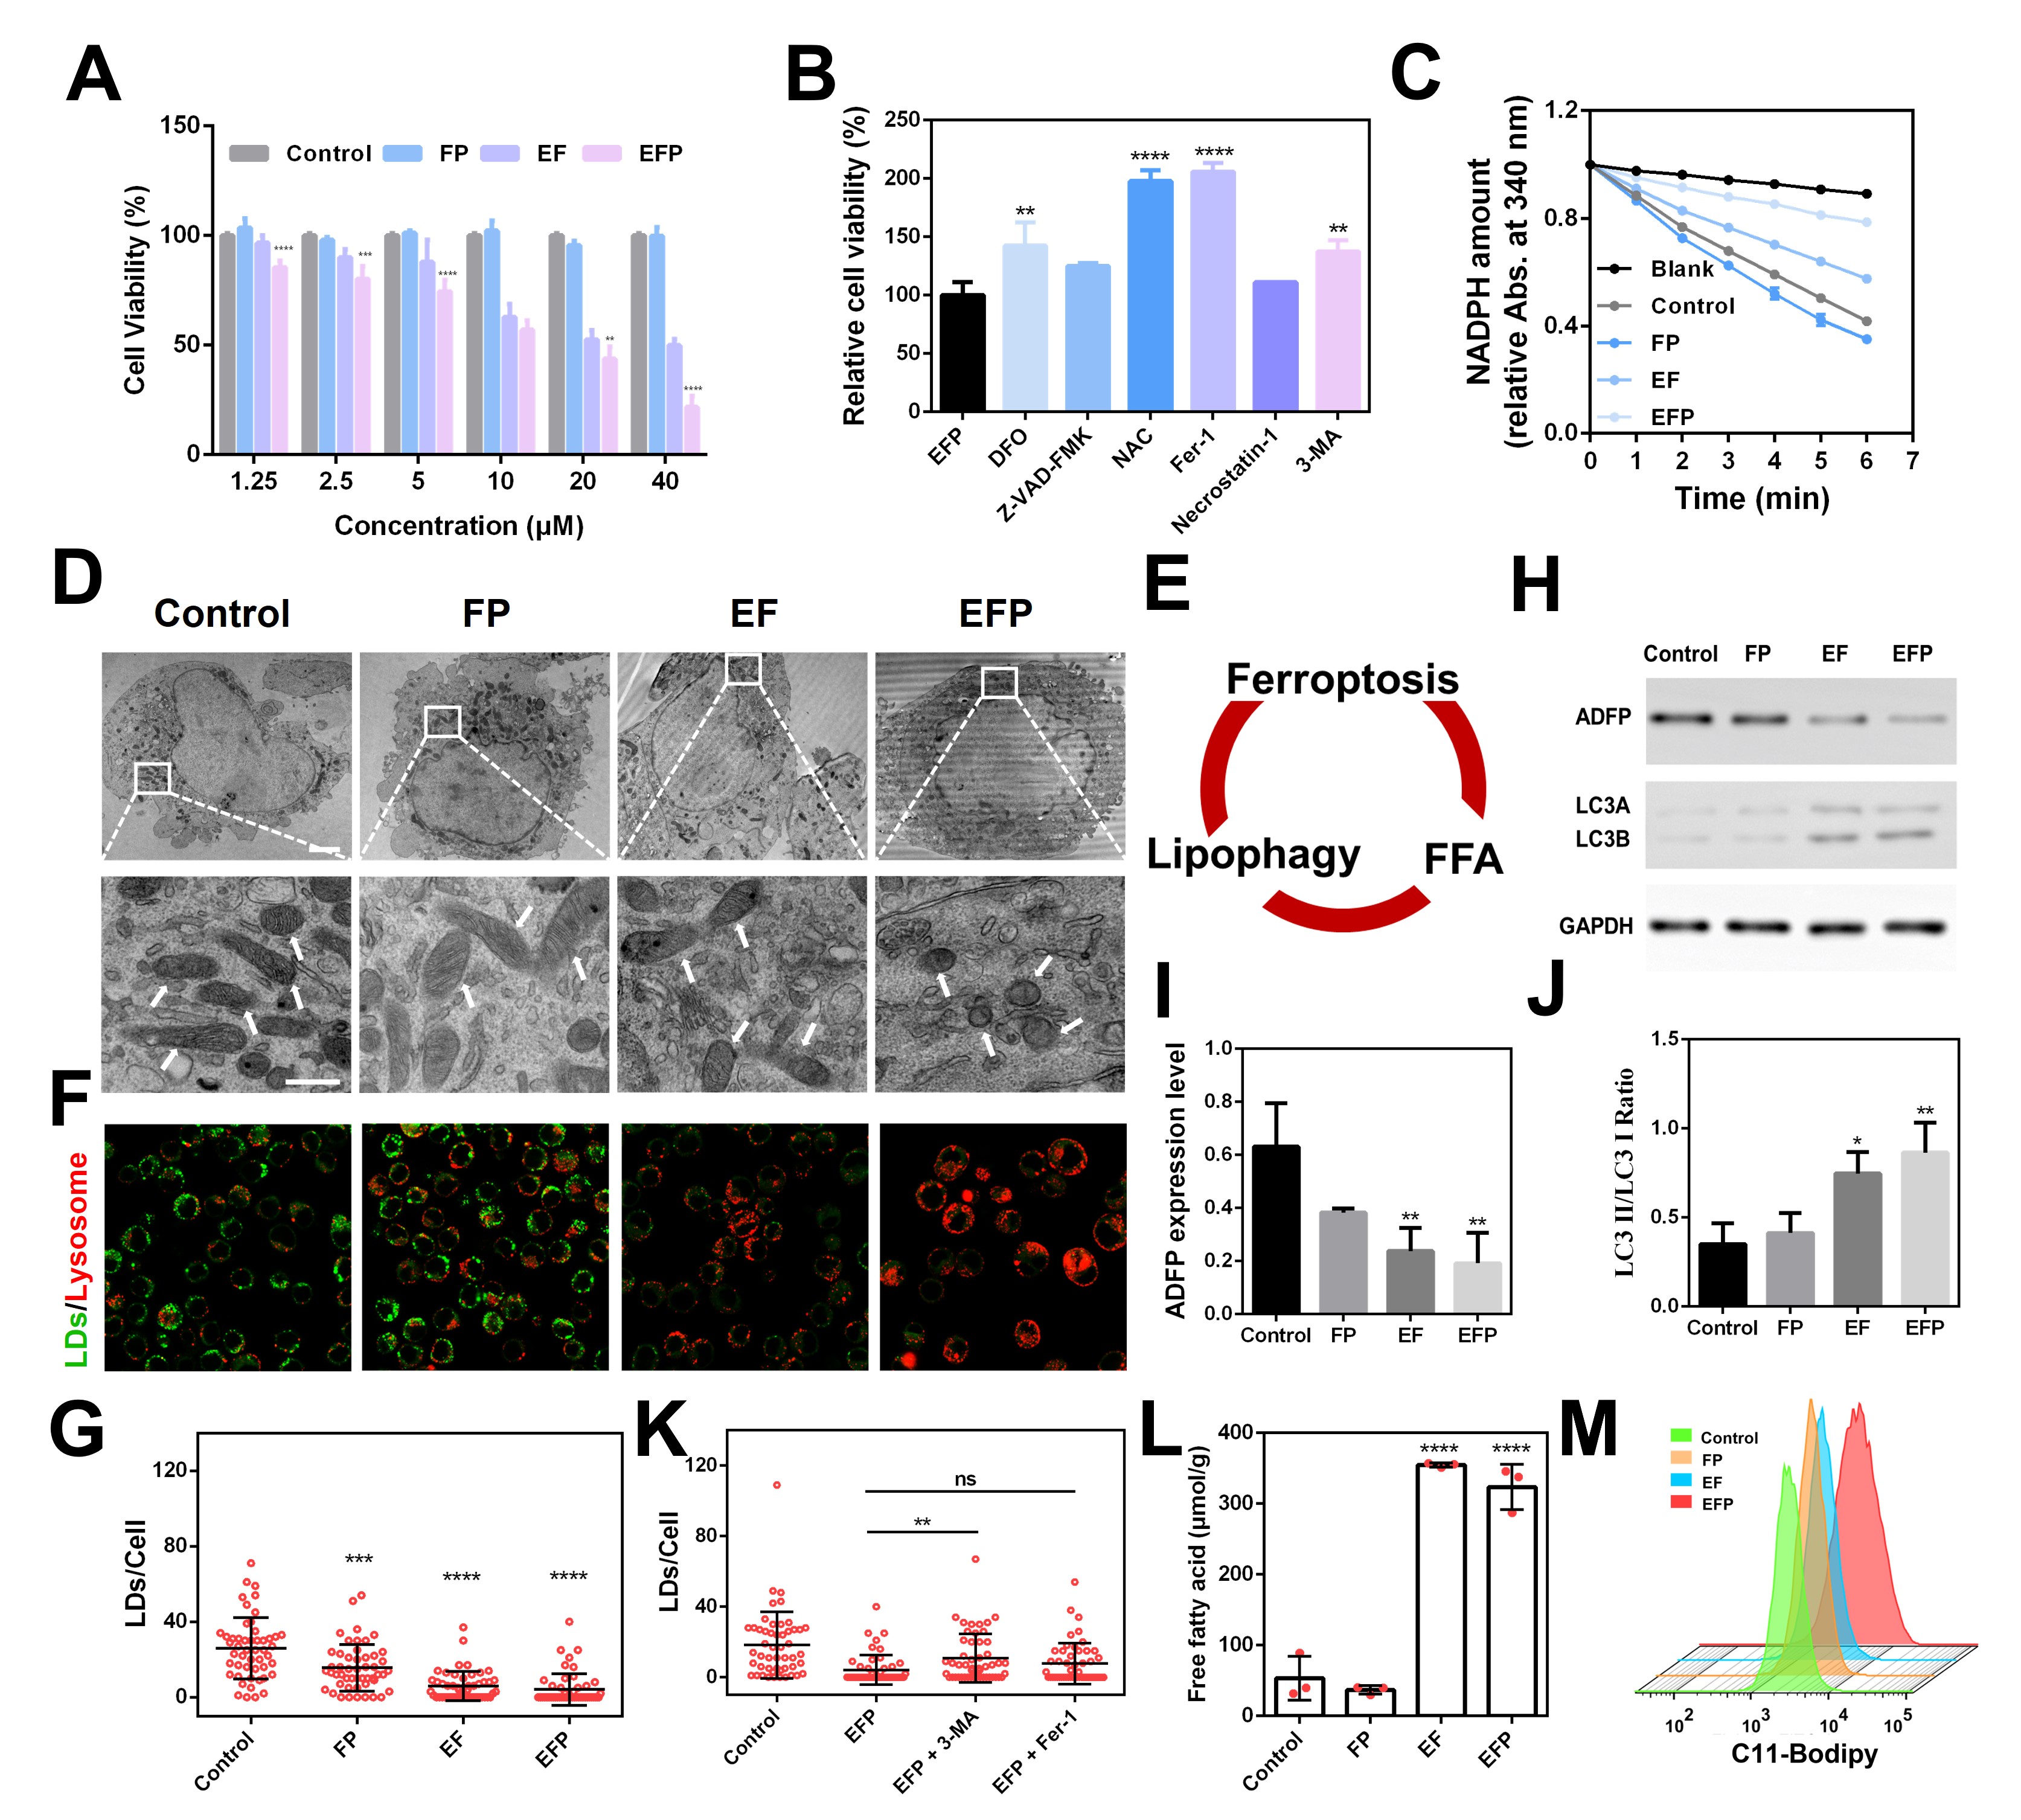 Figure 2. The lipophagy-fuled ferroptosis mechanism of EFP. (A) The cell viability of B16 cells after different treatments. (B) Relative cell viability of B16 cells treated with EFP and different regulated cell death pathway inhibitors. (C) GPX4 activity of B16 cells. (D) Mitochondrial morphology of B16 cells with different treatments. (E) Schematical illustration of lipophagy-fuled ferroptosis. (F) The confocal laser scanning microscopy images of LDs and lysosomes. (G) The quantitative analysis of LDs numbers per cell. (H) The western blot images and analysis of ADFP and LC3I/LC3II expression. (I-J) Semi-quantitative analysis of ADFP and LC3II/LC3I expression. (K) The quantitative analysis of LDs numbers per cell treteted with different inhibitors. (L) The intracellular FFA level with different treatments. (M) The LPO level analyzed by flow cytometry.
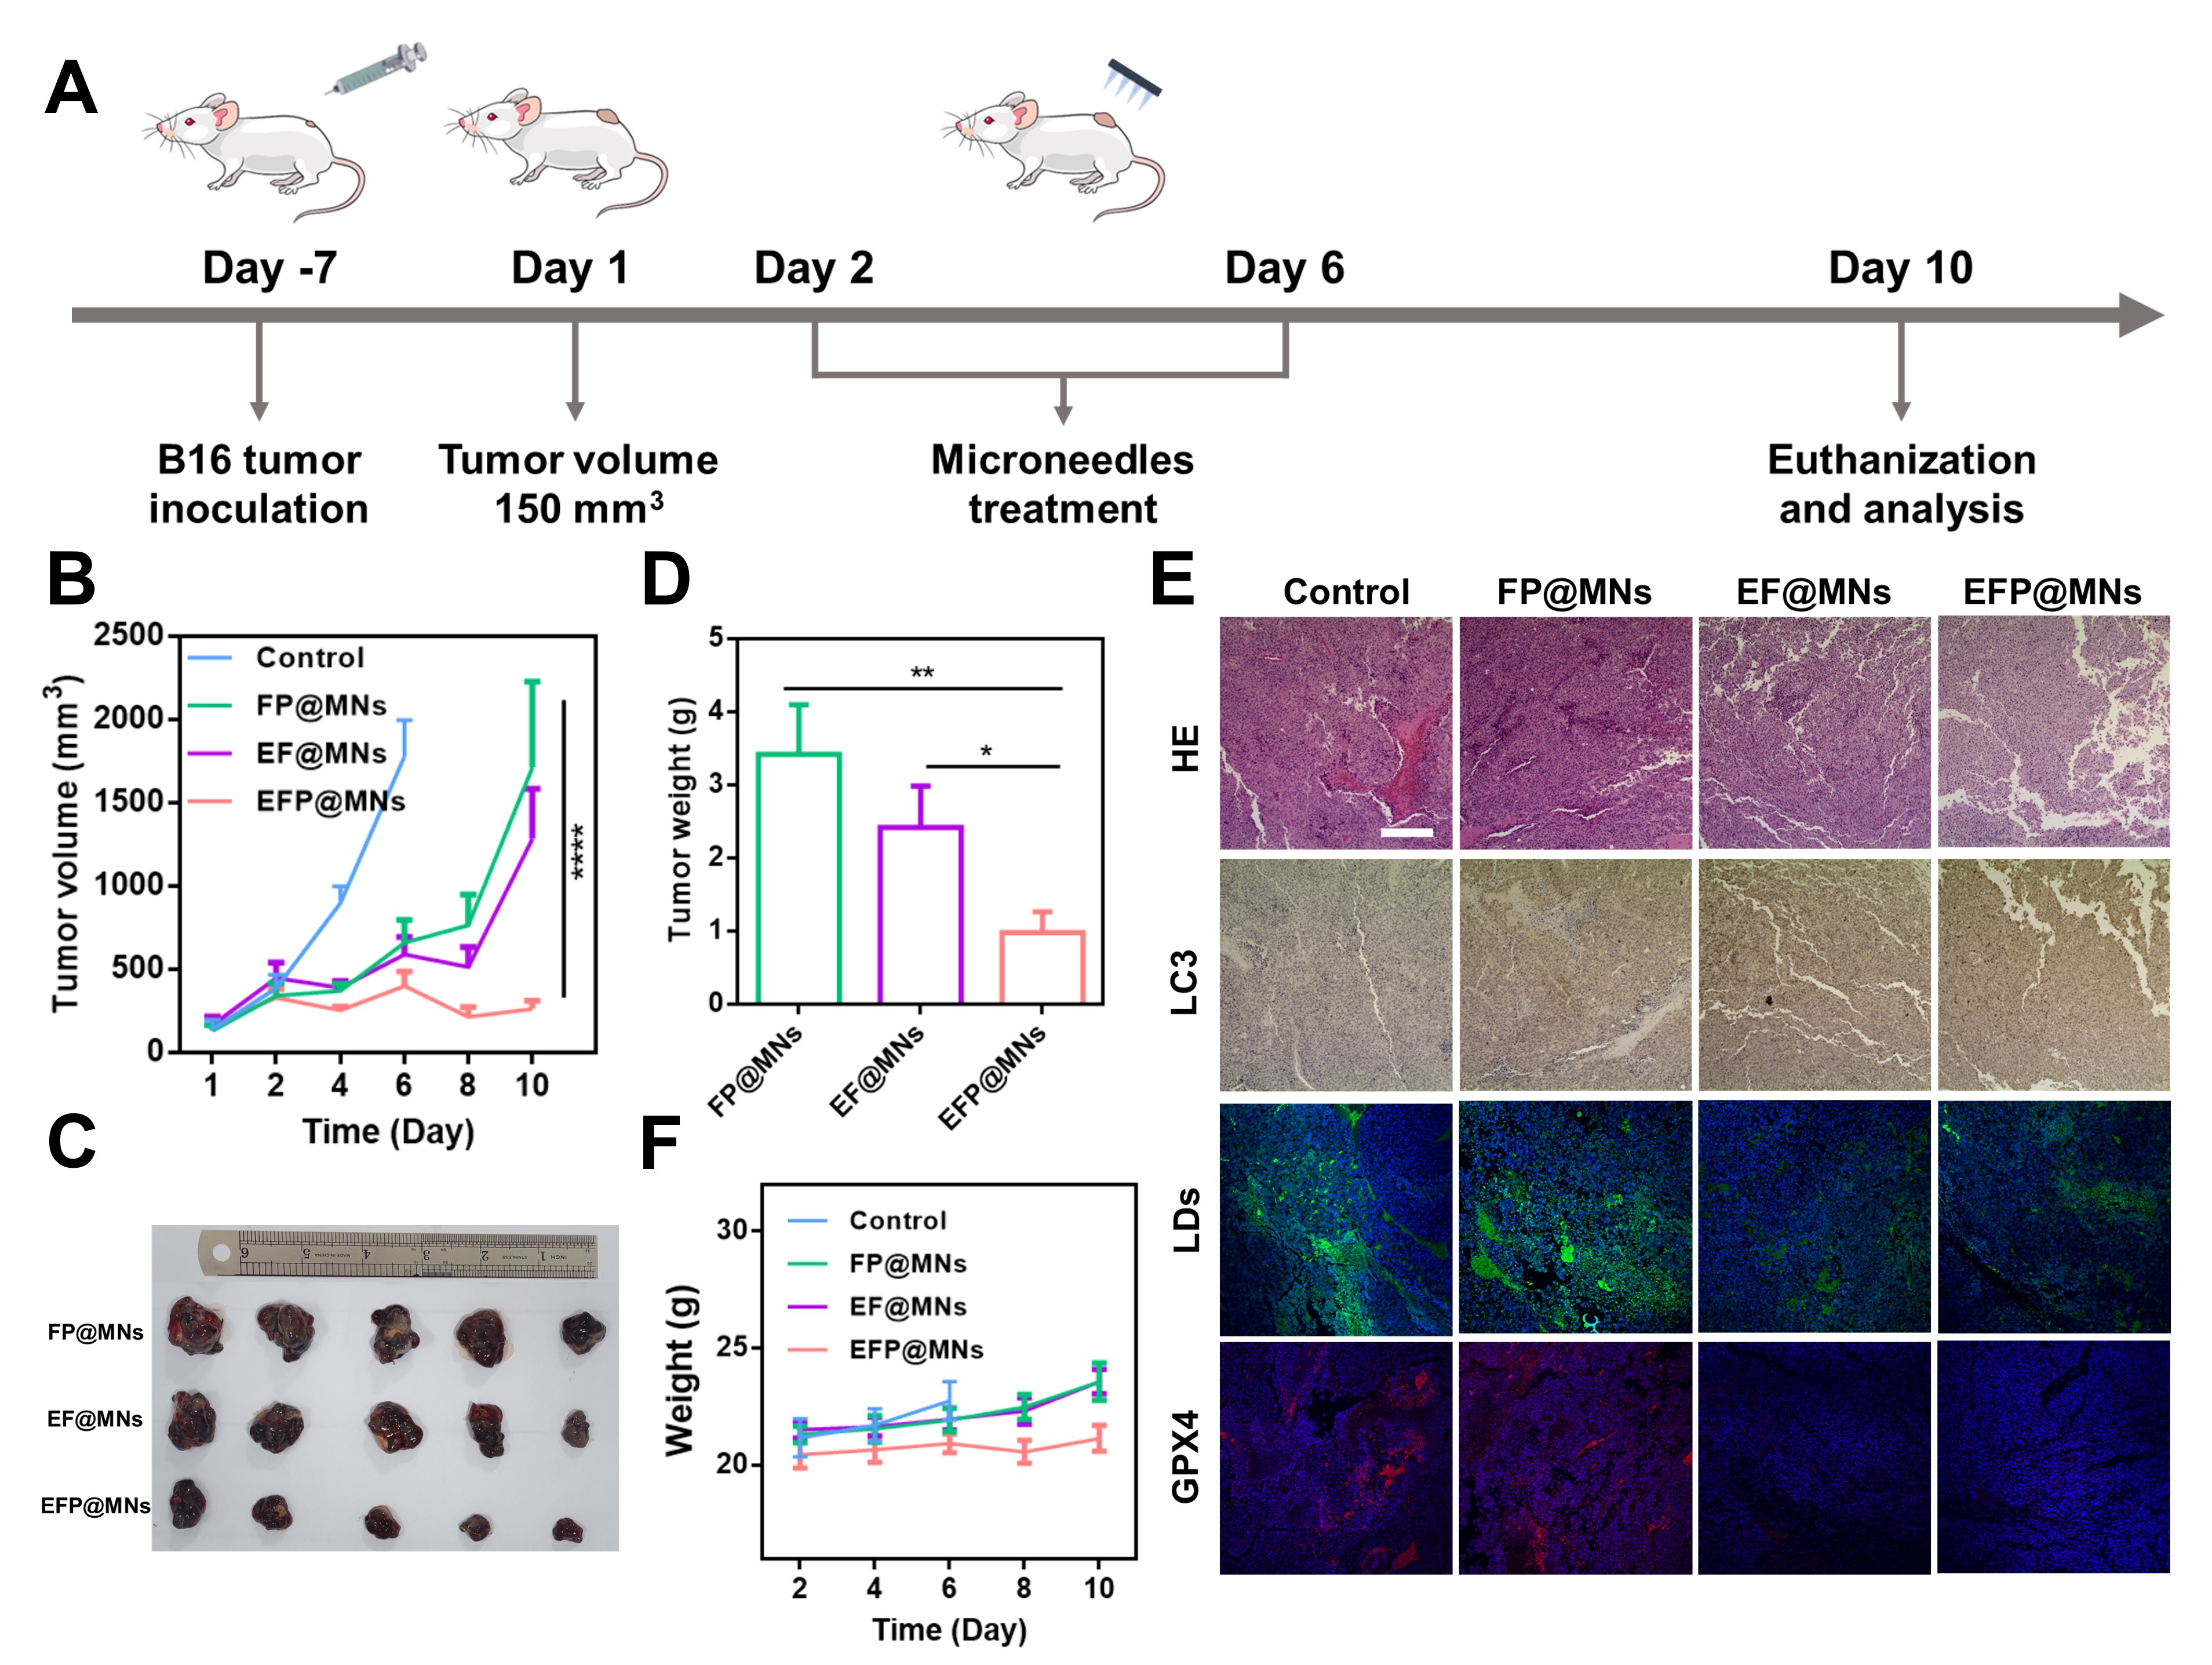 Figure 3. The in vivo anti-tumor effect of EFP@MNs. (A) The schematical illustration of in vivo antitumor effect evaluation. (B) The tumor volume growth curves with different treatments. (C-D) The images and weights of tumors. (E) The pathological examination of tumor tissues. (F) The body weight curves of mice with different treatments.