
Formulation and Delivery - Chemical
Category: Poster Abstract
 photo")
Ruifeng Wang, MS (he/him/his)
Research Assistant
University of Connecticut
STORSS, Connecticut, United States
Ruifeng Wang, MS (he/him/his)
Research Assistant
University of Connecticut
STORSS, Connecticut, United States
Andrew G. Clark, Ph.D. (he/him/his)
DigiM Solution LLC
Woburn, Massachusetts, United States
Quanying Bao, Ph.D. (she/her/hers)
University of Connecticut
Storrs, Connecticut, United States
Yan Wang, Ph.D. (she/her/hers)
Staff Fellow
US Food and Drug Administration
Silver Spring, Maryland, United States
Bin Qin, Ph.D.
US Food and Drug Administration
Silver Spring, Maryland, United States
 photo")
Shawn Zhang, Ph.D. (he/him/his)
Managing Partner
DigiM Solution LLC
Woburn, Massachusetts, United States
 photo")
Diane J. Burgess, Ph.D. (she/her/hers)
Distinguished Professor
University of Connecticut
Storrs, Connecticut, United States
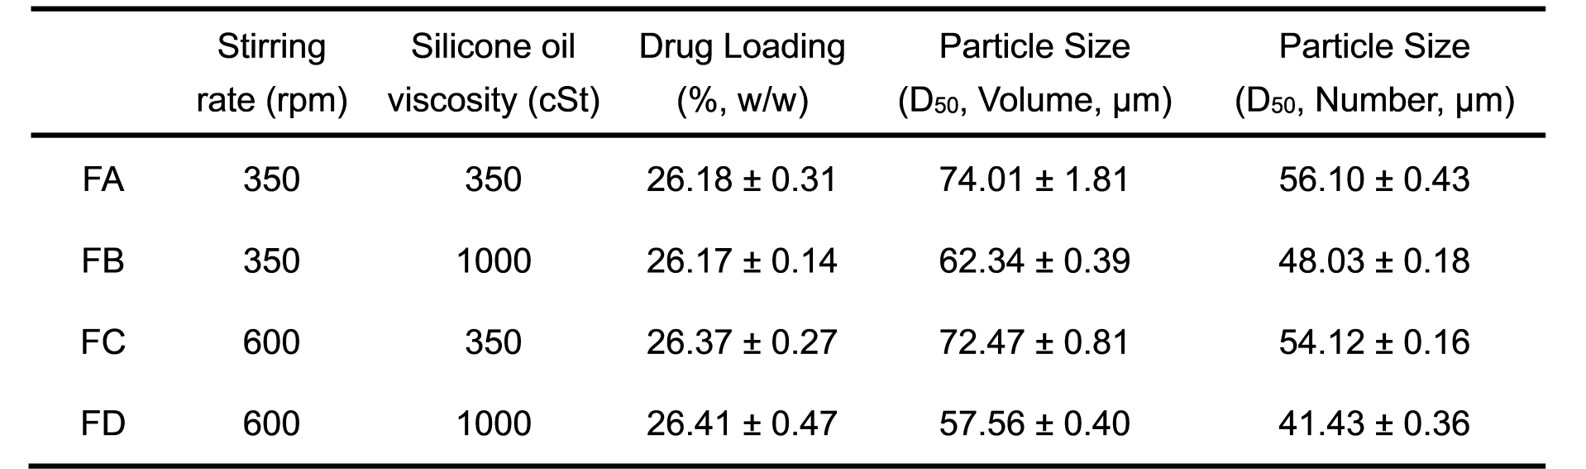 Table 1. Drug loading and particle size of the prepared microsphere formulations. All data are presented as mean ± SD (n=3).
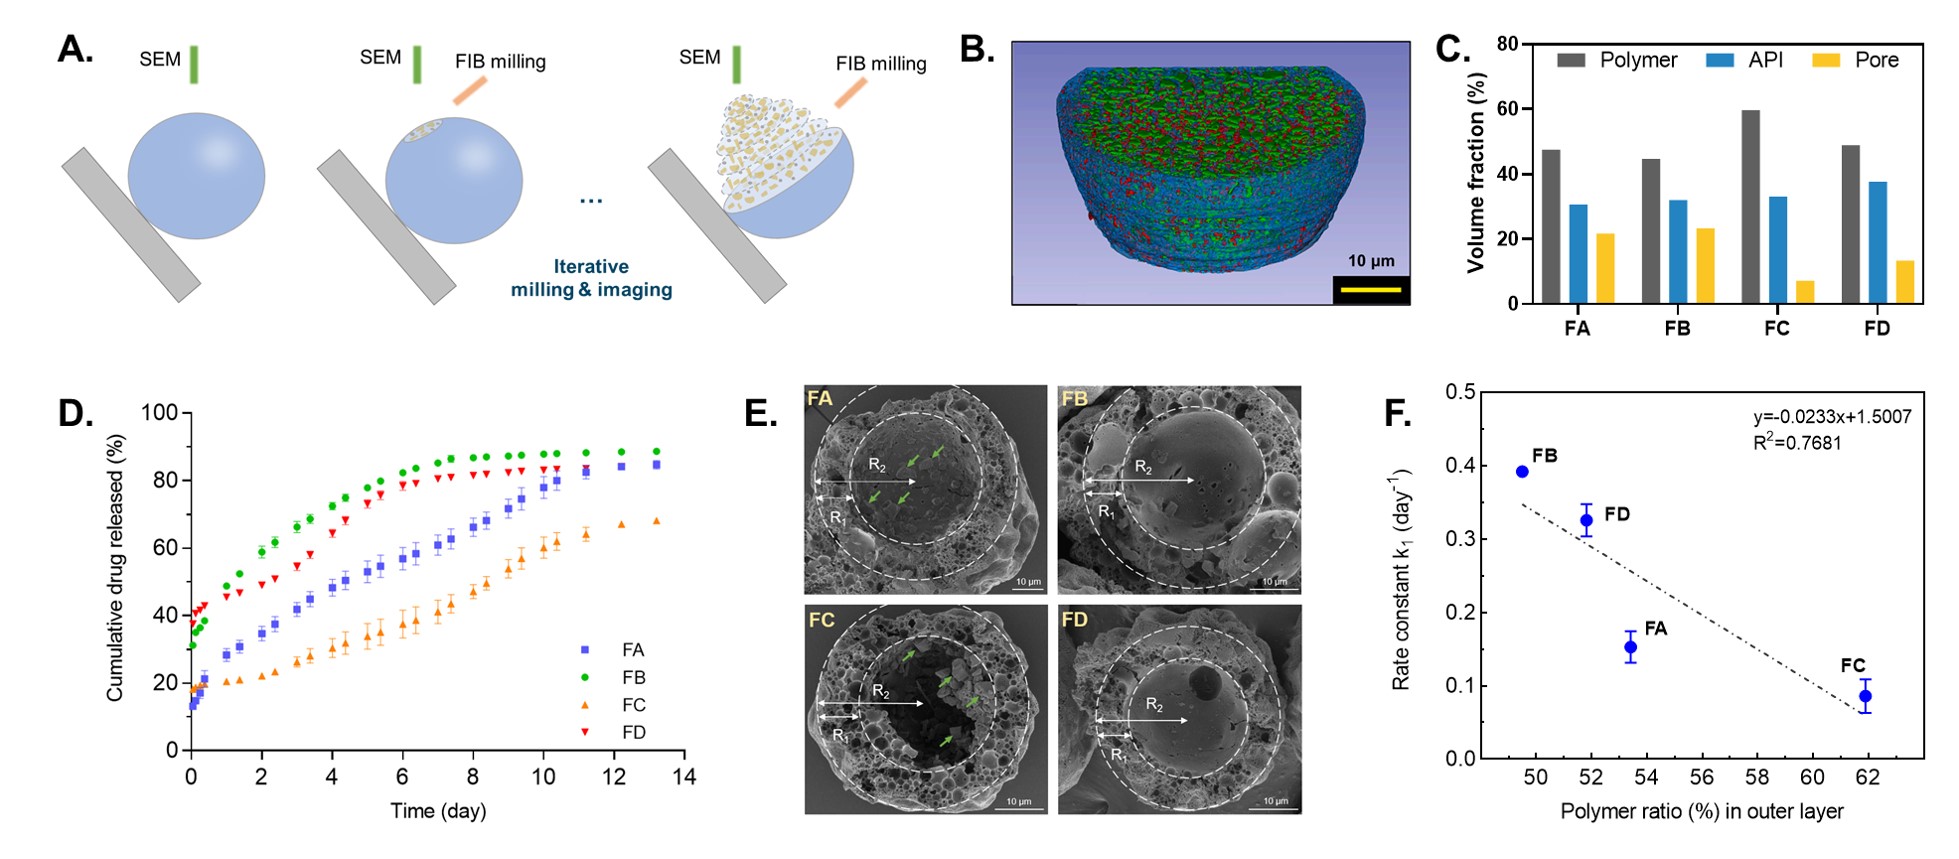 Figure 1. (A) Schematic overview of FIB-SEM imaging of a microsphere; (B) representative 3D reconstruction with polymer phase (blue), API phase (green), and pore phase (red); (C) 3D volume fractions of different phases of the prepared microsphere formulations; (D) in vitro release profiles of the prepared microspheres using the sample-and-separate method at 37℃ in 10 mM PBS (pH 7.4) containing 0.02% (v/v) Tween 20 (mean ± SD, n=3); (E) SEM cross-sectional images of the prepared microsphere formulations incubated in release medium at Day 6. The green arrows point to the remaining drug particles inside the microspheres. The ratio of R1/R2 is 35%; (F) correlation between the volume ratio of the polymer in the 35% outer shell layer and the release constant k1 using first-order model fitting for the prepared microsphere formulations.