
Manufacturing and Analytical Characterization - Chemical
Category: Poster Abstract
Isidoro Caraballo, Doctor in Pharmacy (he/him/his)
Universidad de Sevilla
Seville (Spain), Andalucia, Spain
Vicente Linares, Pharmacist (he/him/his)
University of Seville
seville, Andalucia, Spain
Angela Aguilar-de-Leyva, Doctor in Pharmacy (she/her/hers)
University of Seville
Seville, Andalucia, Spain
Juan Dominguez-Robles (he/him/his)
University of Seville
seville, Andalucia, Spain
Marta Casas, Doctor in Pharmacy (she/her/hers)
University of Seville
seville, Andalucia, Spain
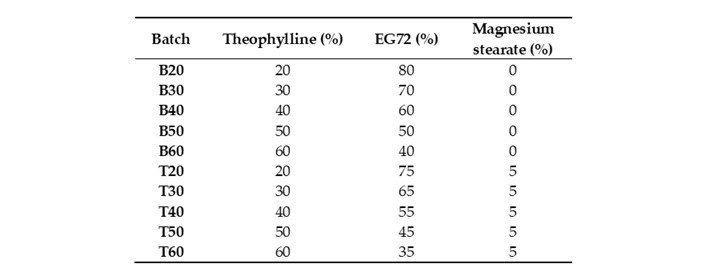 Table 1. Composition of the batches prepared.
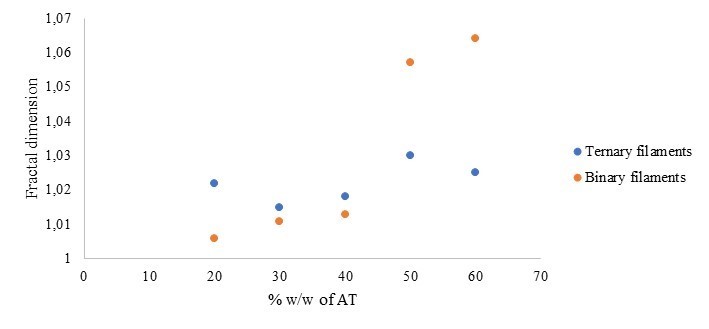 Figure 1. Graphical representation of the fractal dimension versus the percentage of AT in the prepared filaments.
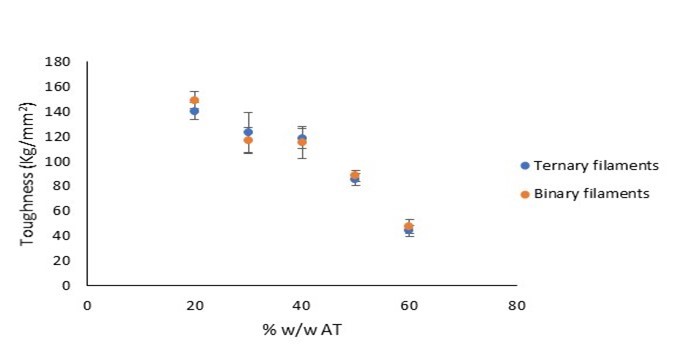 Figure 2. Graphical representation of the toughness versus the percentage w/w of theophylline in the filaments prepared.