
Manufacturing and Analytical Characterization - Chemical
Category: Poster Abstract
Elke Prasad, Ph.D. (she/her/hers)
University of Strathclyde
GLASGOW, Scotland, United Kingdom
Elke Prasad, Ph.D. (she/her/hers)
University of Strathclyde
GLASGOW, Scotland, United Kingdom
Ecaterina Bordos (she/her/hers)
University of Strathclyde
Glasgow, Scotland, United Kingdom
Vaughan S. Langford, Ph.D. (he/him/his)
Syft Technologies Ltd
Christchurch, Canterbury, New Zealand
Mark J. Perkins, Ph.D. (he/him/his)
Element Materials Testing Ltd.
Cambridge, England, United Kingdom
John Robertson, Ph.D. (he/him/his)
University of Strathclyde
Glasgow, Scotland, United Kingdom
Gavin Halbert (he/him/his)
University of Strathclyde
Glasgow, Scotland, United Kingdom
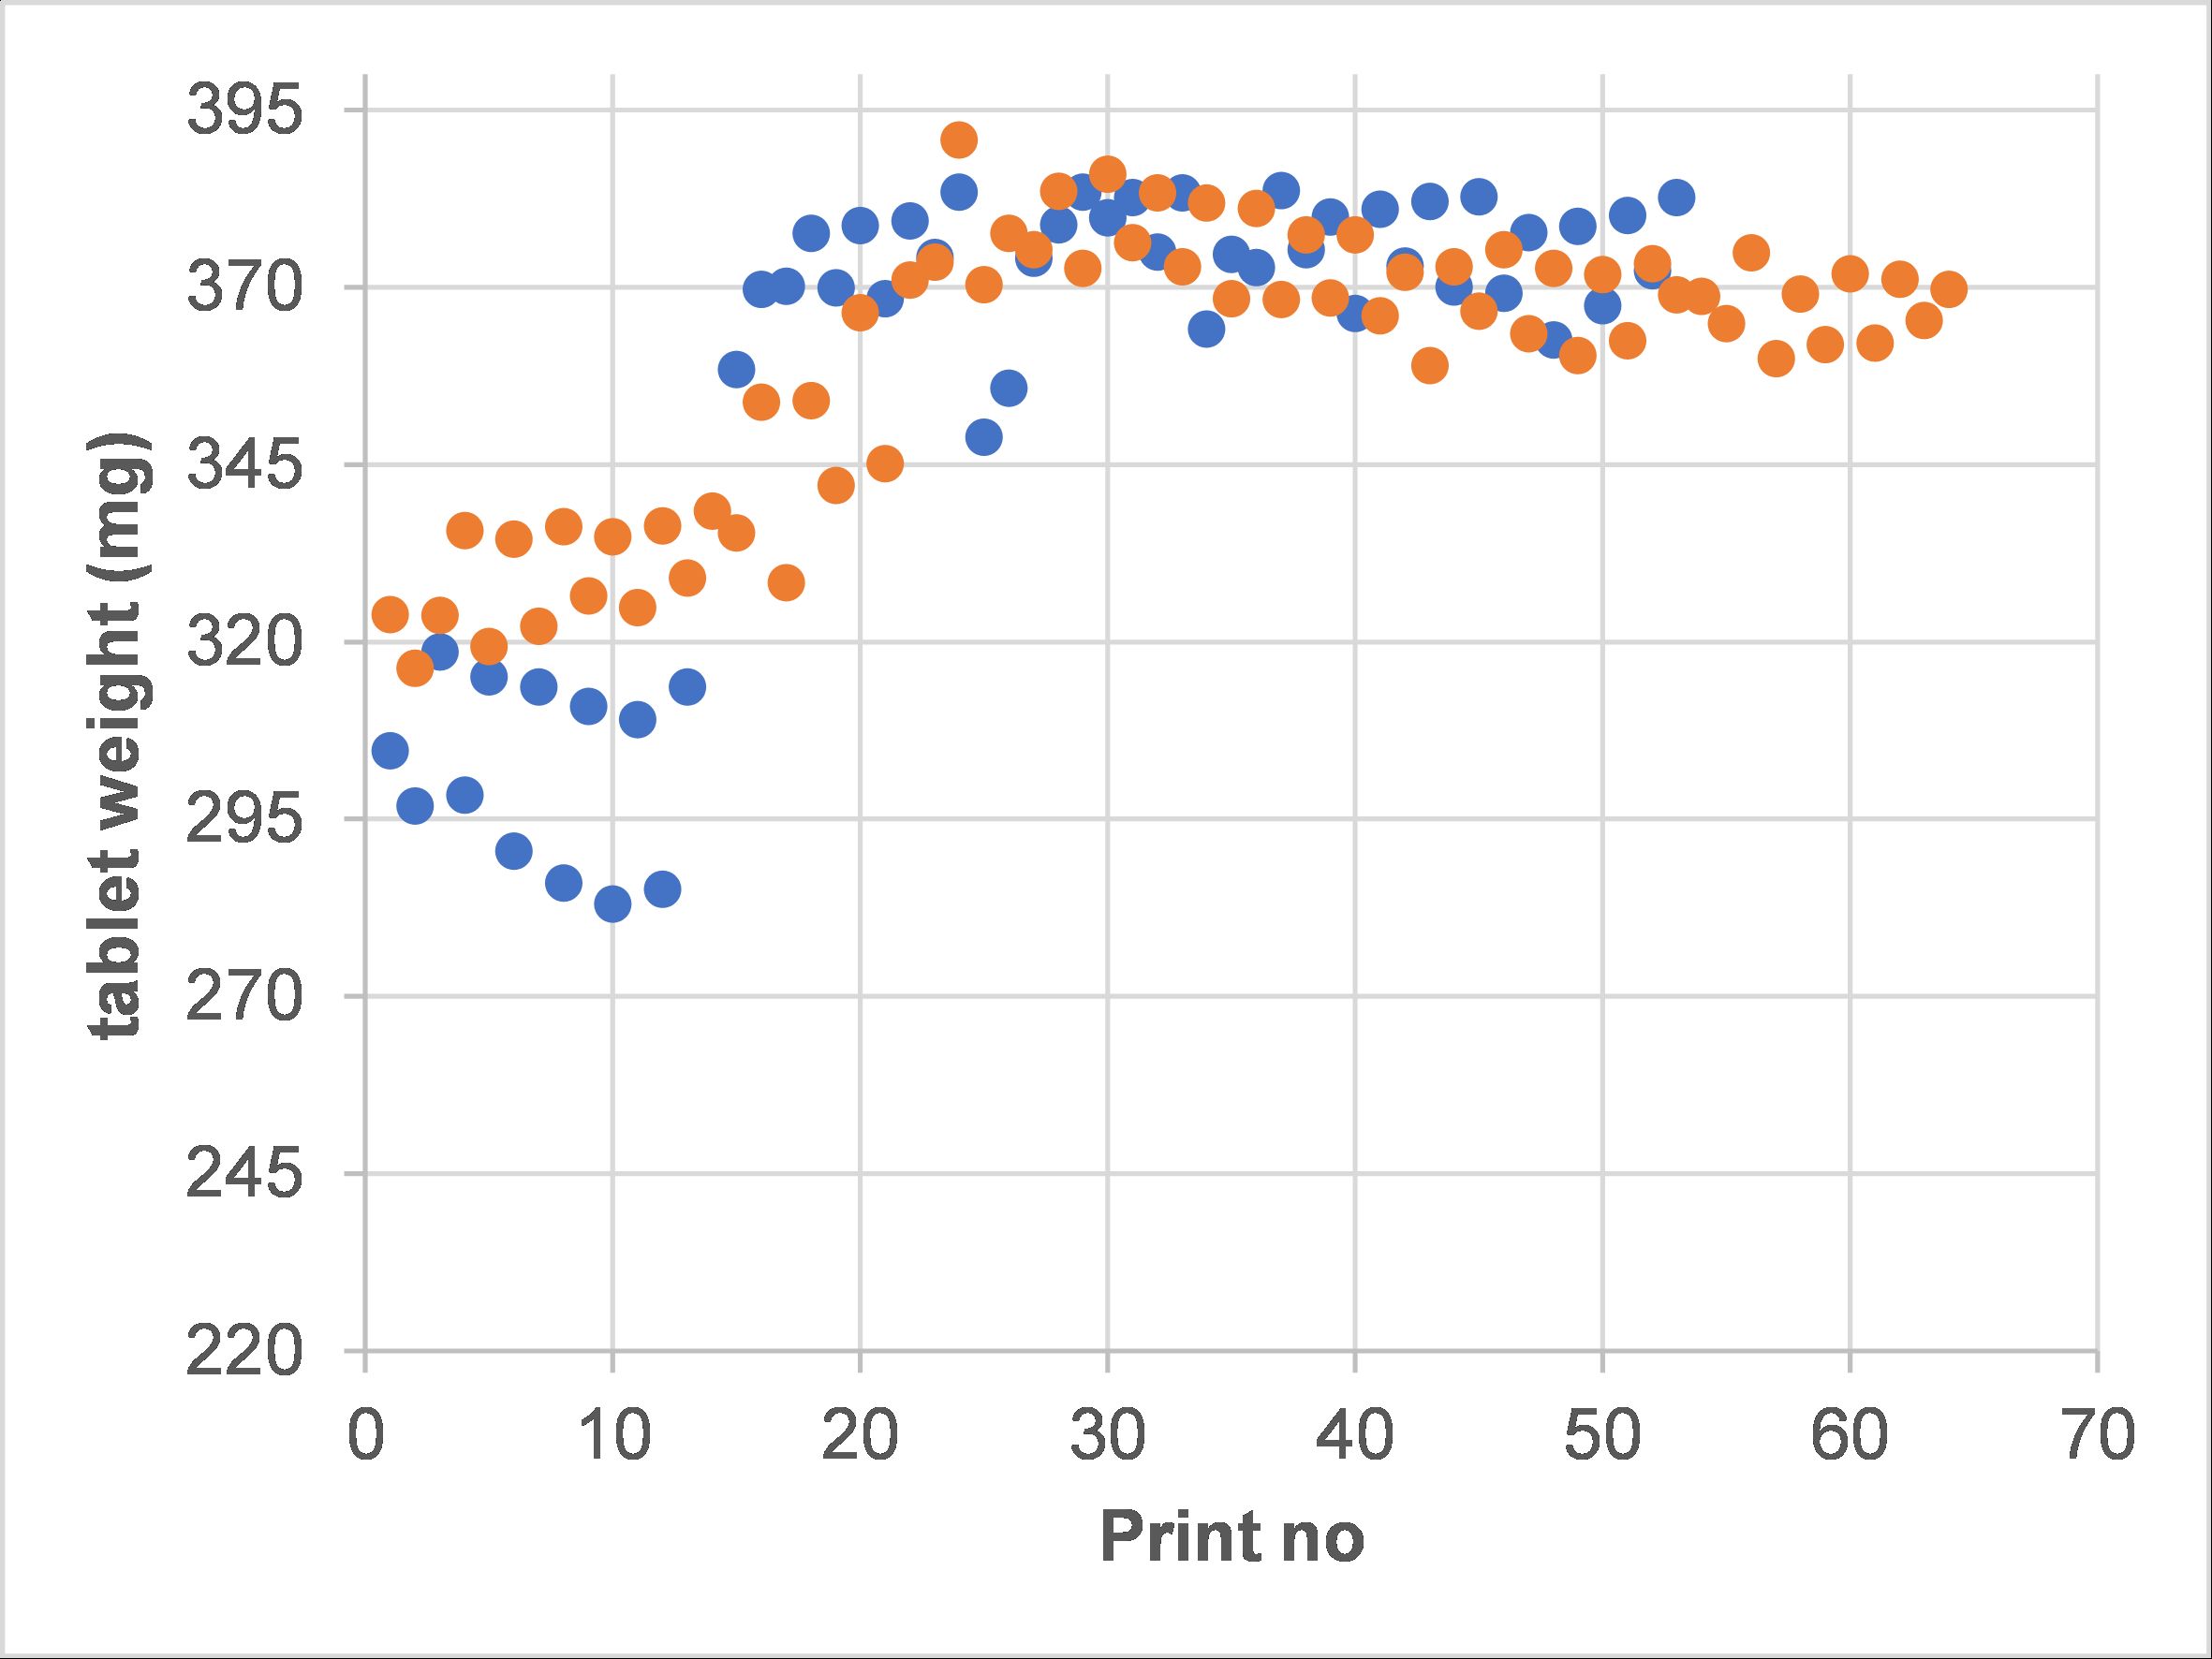 Figure 1: 3DP tablet weight versus number of prints of a 50 % w/w PCM-Plasdone™ S-630 formulation processed at 130°C and linear print speed of 40mm/s: orange squares – manufacture run 1, blue circles – manufacture run 2.
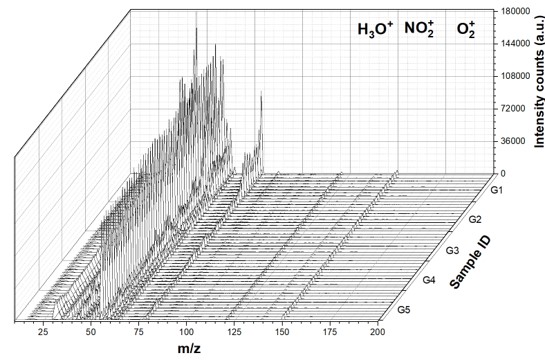 Figure 2: SIFT-MS mass scan (n=10) versus sampling interval (G1, G2, G3, G4, G5): Intensity counts (a.u.) versus SIFT-MS product mass charge ratio (m/z) for all reagents (H30+, NO+, O2+).
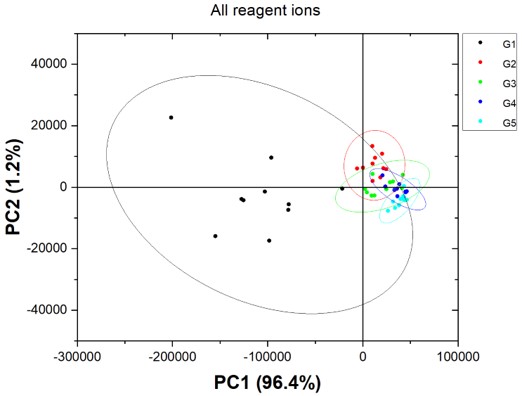 Figure 3: Score plot of principal component 1 and 2 of all products of all reagent ions (H30+, NO+, O2+) and sampling intervals (G1 - G5).