
Formulation and Delivery - Biomolecular
Category: Poster Abstract
Dnyandev G. Gadhave, Sr., Ph.D. (he/him/his)
St. John's University
New York, New York, United States
Dnyandev G. Gadhave, Sr., Ph.D. (he/him/his)
St. John's University
New York, New York, United States
Vivek Gupta, Ph.D. (he/him/his)
St. John's University
New York, New York, United States
.jpg) Figure 1: Optimization of nanoformulations: A) construction of pseudo-ternary phase diagram, B) risk analysis for the formulation of quetiapine hemifumarate nanoparticles, response surface plot for C) effects of formulation variables on globule size, D) effects of formulation variables on poly-dispersibility index and E) effects of formulation variables on zeta potential.
Figure 1: Optimization of nanoformulations: A) construction of pseudo-ternary phase diagram, B) risk analysis for the formulation of quetiapine hemifumarate nanoparticles, response surface plot for C) effects of formulation variables on globule size, D) effects of formulation variables on poly-dispersibility index and E) effects of formulation variables on zeta potential.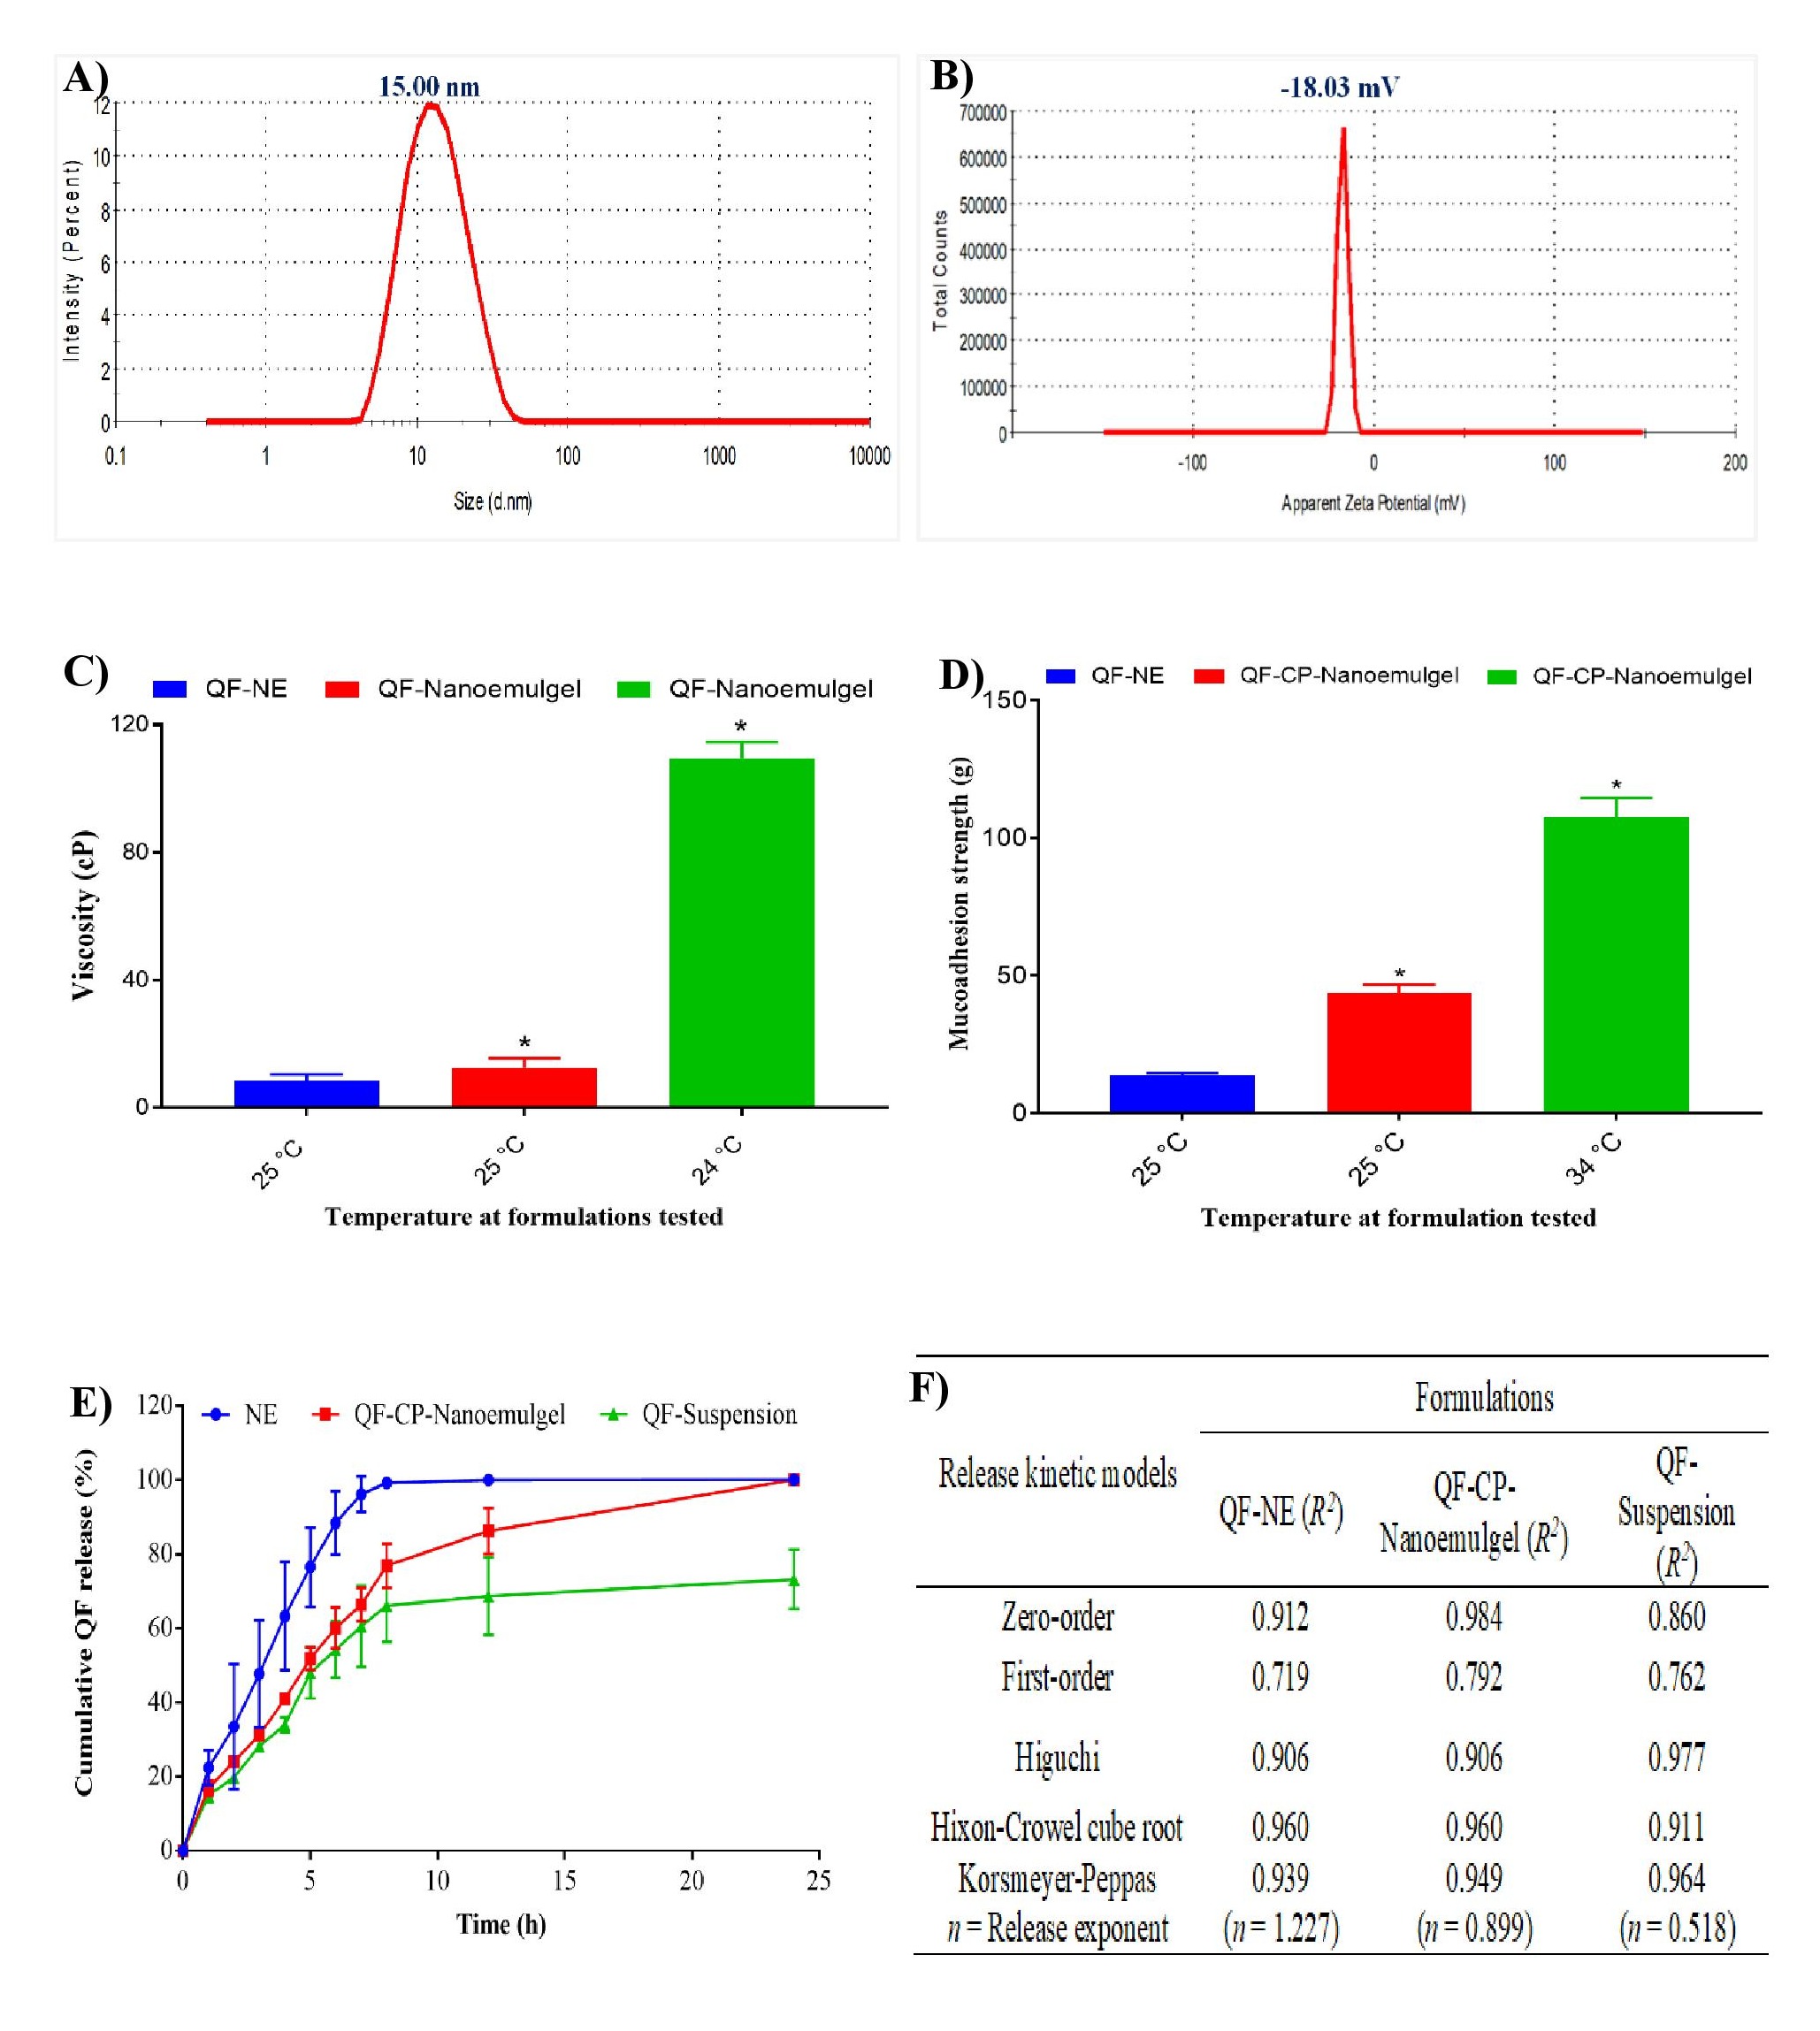 Figure 2: Evaluation of A) globule size, B) zeta potential, C) viscosity, D) ex vivo mucoadhesive strength, E) in vitro cumulative drug release study, and F) release kinetic study.
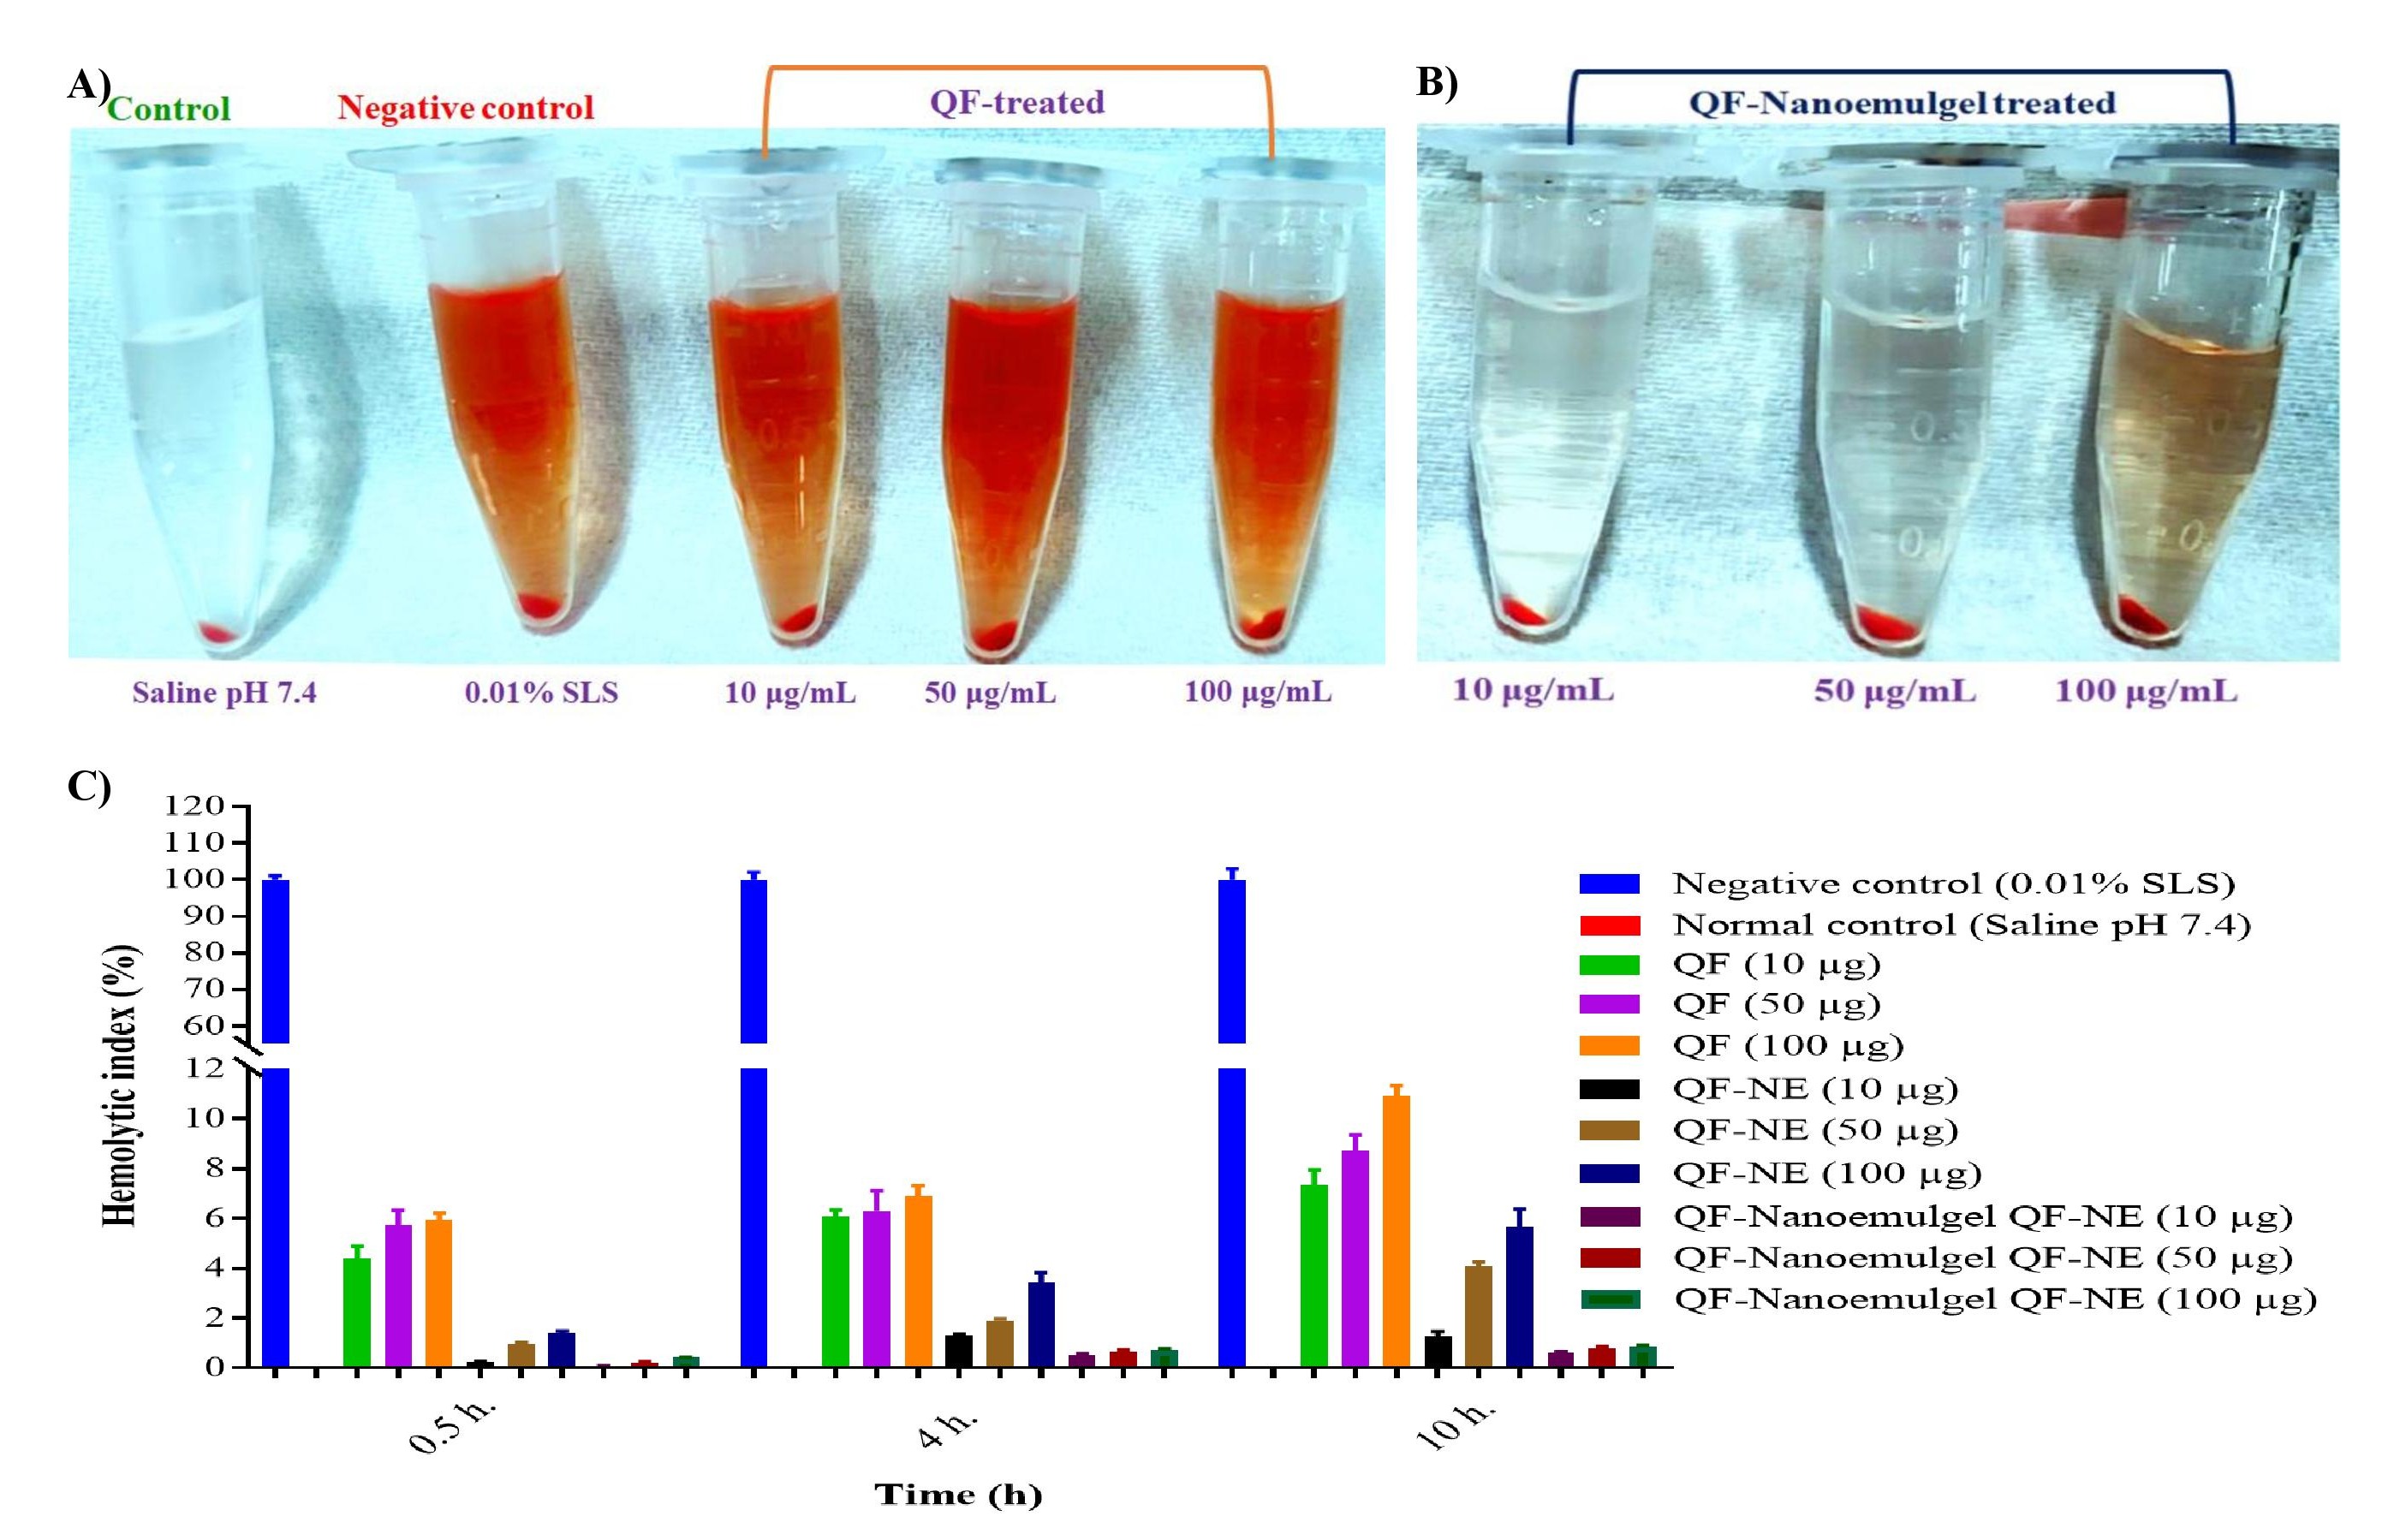 Figure 3: In vitro hemolysis study for developed QF-loaded nanoformulations: A) comparative hemolysis study of control (saline) against SLS-control (negative control) and pure QF at different concentrations (10, 50 and 100 μg/mL), B) hemolysis study for developed nanoformulation at different concentrations (10, 50 and 100 μg/mL), and C) % hemolysis index caused by different formulations.