
Formulation and Delivery - Biomolecular
Category: Poster Abstract
Aaron Tasset, BS
University of Texas at Austin
Austin, Texas, United States
Wenliang Wang, Ph.D.
University of Texas at Austin
Austin, Texas, United States
Ilya Pyatnitskiy, M.D.
University of Texas at Austin
Leander, Texas, United States
Huiliang Wang, Ph.D.
University of Texas at Austin
Austin, Texas, United States
.jpg) Figure 1: DNA condensation using reversible crosslinkers. (a) The Dynamic Light Scattering (DLS) tests of original DNA and b-DNA; (b) The measurements of DNA crosslinking density and DNA hydration size changes with the reaction time, where crosslinker PEG2000 is used; (c) the measurements of DNA crosslinking density and DNA surface potential changes with the reaction time, where crosslinker PEG2000 is used; (d) The crosslinking density of DNA after reacting with various linkers for 24 h; (e) The final DNA hydration size after reacting with different linkers for 24 h (n=3 per group, one-way ANOVA); (f) The final DNA surface potential after reacting with various linkers for 24 h (n=3 per group, one-way ANOVA). All plots show mean ± SEM unless otherwise mentioned. *P < 0.05, **P < 0.01, ***P < 0.001, ****P < 0.0001; ns, not significant.
Figure 1: DNA condensation using reversible crosslinkers. (a) The Dynamic Light Scattering (DLS) tests of original DNA and b-DNA; (b) The measurements of DNA crosslinking density and DNA hydration size changes with the reaction time, where crosslinker PEG2000 is used; (c) the measurements of DNA crosslinking density and DNA surface potential changes with the reaction time, where crosslinker PEG2000 is used; (d) The crosslinking density of DNA after reacting with various linkers for 24 h; (e) The final DNA hydration size after reacting with different linkers for 24 h (n=3 per group, one-way ANOVA); (f) The final DNA surface potential after reacting with various linkers for 24 h (n=3 per group, one-way ANOVA). All plots show mean ± SEM unless otherwise mentioned. *P < 0.05, **P < 0.01, ***P < 0.001, ****P < 0.0001; ns, not significant.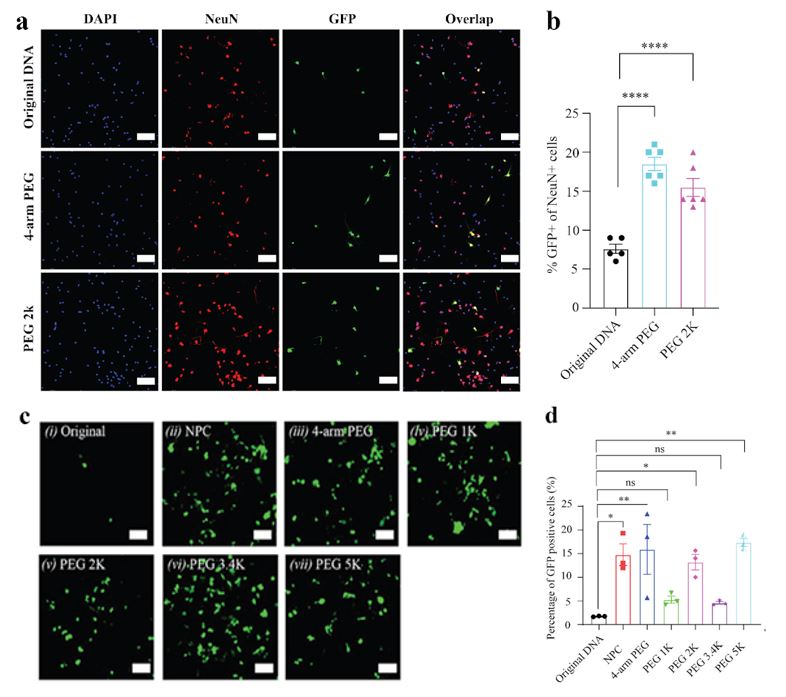 Figure 2: Enhanced green fluorescence protein (GFP) expression of 6.2 kbp b-DNA and 11.2 kbp b-DNA through reversible crosslinkers in vitro. (a) GFP expression images of primary neurons using polymer/DNA(6.2kbp) complexes, where the neuron nucleuses were stained with NeuN (red) and the total cell population nucleuses with DAPI (blue). Scale bar: 100 μm; (b) the corresponding statistics quantification analysis of (a) (n ≥ 2 per group, one-way ANOVA); (c) GFP expression images of HEK cells by various PEI/b-DNA (11.2 kbp) complexes at N/P of 5, (i) original DNA, and condensed DNA via (ii) NPC linker, (iii) 4-arm-PEGylated NPC linker, (iv) PEG1000 NPC linker, (v) PEG2000 NPC linker, (vi) PEG3400 NPC linker, (vii)PEG5000 NPC linker, scale bar: 100 μm, and (d) the corresponding flow cytometry quantification analysis of (c) (n = 3 per group, one-way ANOVA). All plots show mean ± SEM unless otherwise mentioned. *P < 0.05, **P < 0.01, ***P < 0.001, ****P < 0.0001; ns, not significant.
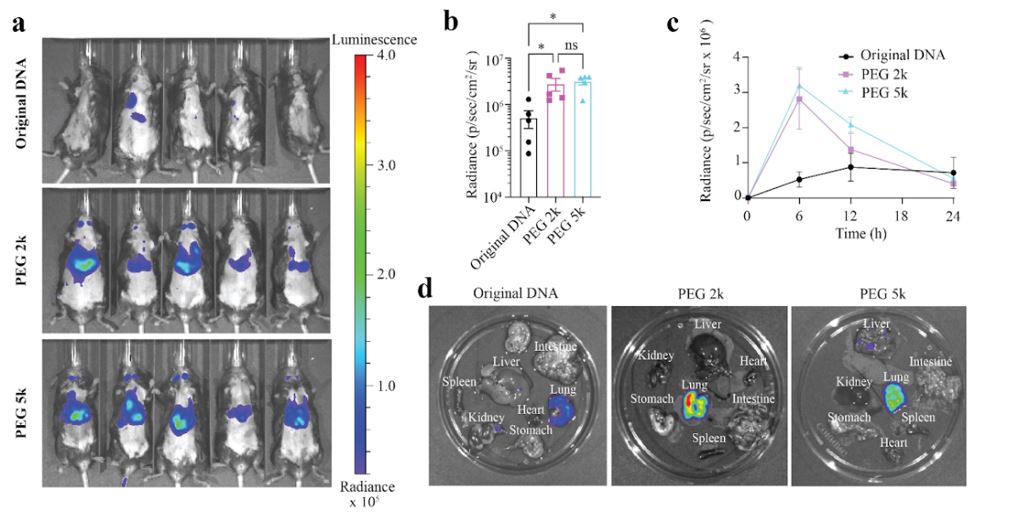 Figure 3: Enhanced in vivo gene delivery efficiency in targeted organs after intravenous administration through RECAST. (a) Bioluminescent images of mice taken with IVIS after 6 h post-injection. (b) Statistical analysis of bioluminescent radiance after 6 h post-injection (n=5, one-way ANOVA, Tukey post-hoc testing). (c) Quantification of luciferase expression in the body over time post-treatment (n=5). (d) Bioluminescent images of extracted organs (heart, liver, spleen, lung, kidney, stomach and intestine) 24h post-treatment, All plots show mean ± SEM. *P < 0.05