
Formulation and Delivery - Chemical
Category: Late Breaking Poster Abstract

Dineli T. S Ranathunga, PhD
Computational Scientist
Thermo Fisher Scientific
Bend, Oregon, United States
Dineli T. S Ranathunga, PhD
Computational Scientist
Thermo Fisher Scientific
Bend, Oregon, United States
Thomas Reynolds, Ph.D.
Thermo Fisher Scientific
Bend, Oregon, United States
Sanjay Konagurthu, Ph.D.
Thermo Fisher Scientific
Bend, Oregon, United States
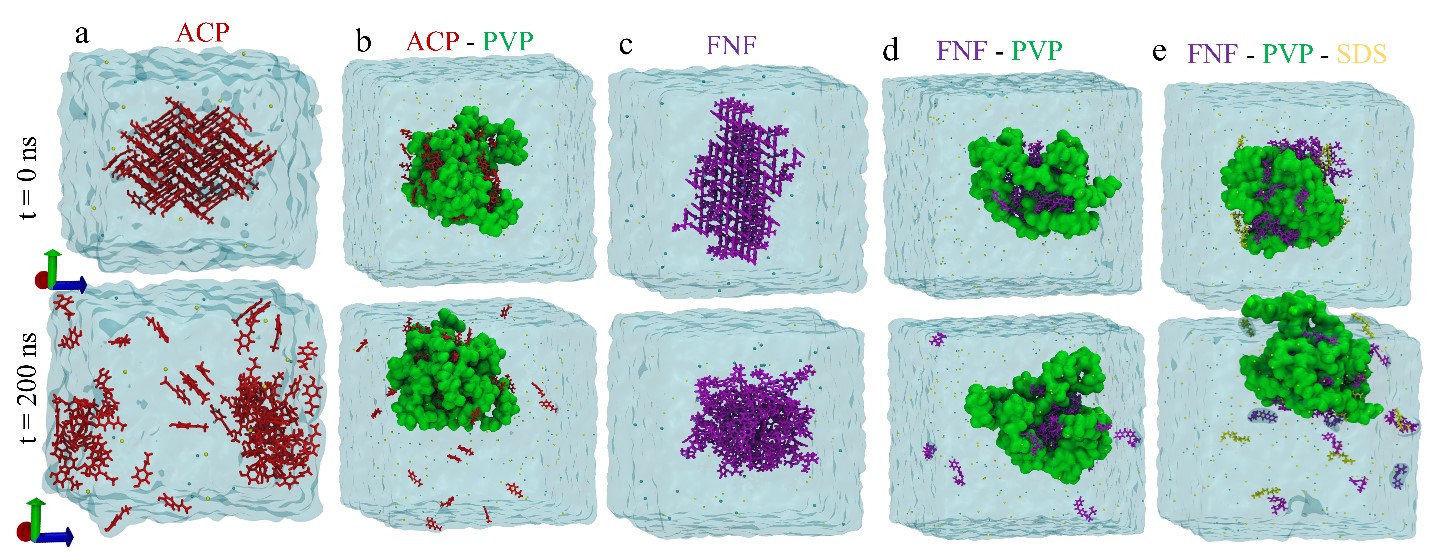 Figure 1: Initial and final (200 ns) MD trajectory snapshots of a) ACP crystalline, b) ACP-PVP ASD, c) FNF crystalline, d) FNF-PVP ASD, and e) FNF-PVP-SDS ASD simulations in 0.15 M aqueous NaCl media. Coloring as follows: water (transparent blue), PVP (green), ACP (red), FNF (purple), SDS (orange), Na+ (yellow) and Cl- (cyan).
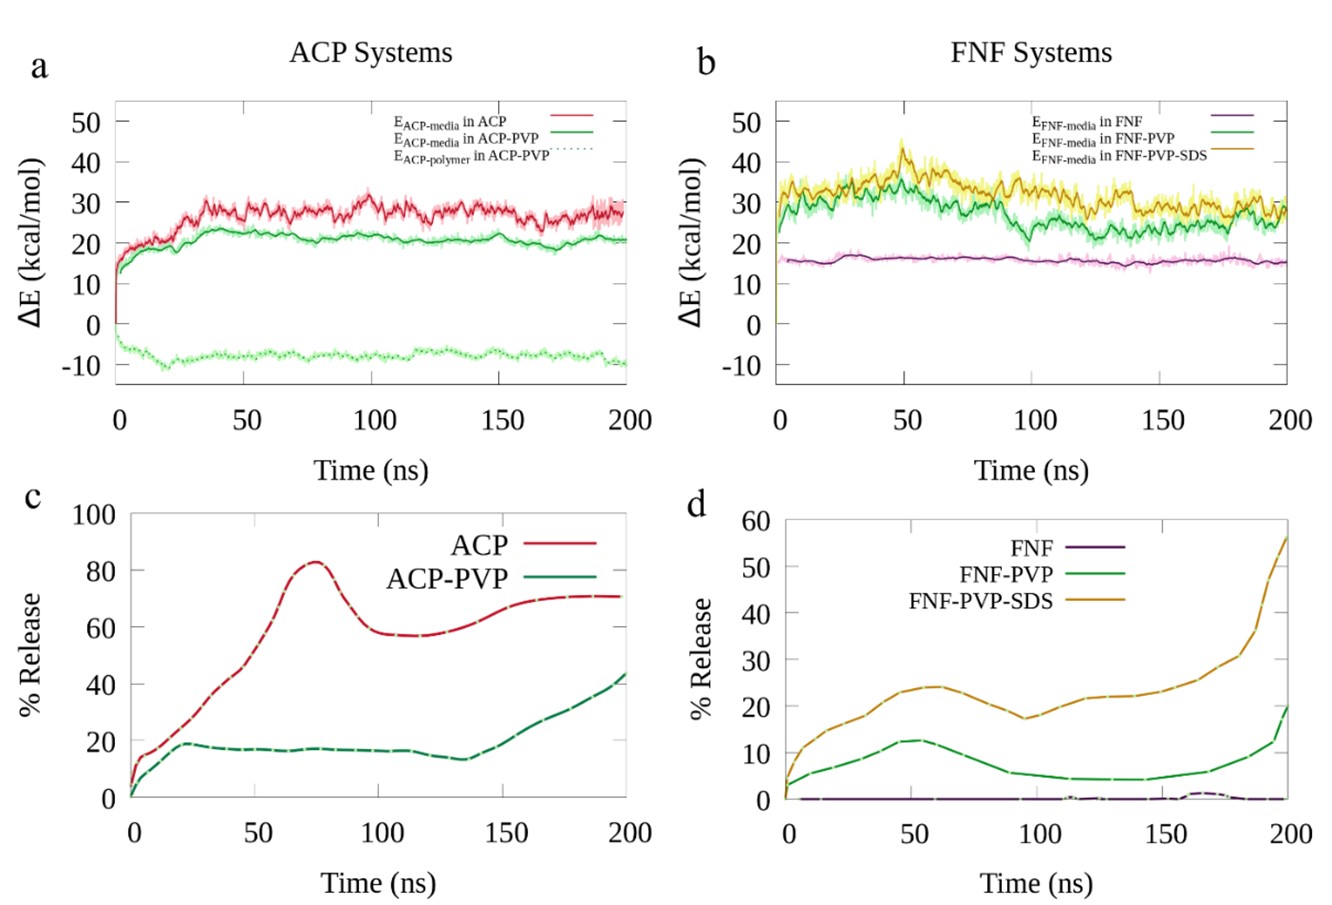 Figure 2: Per molecular interaction energy change with time a) ACP crystalline and ACP-PVP ASD and b) FNF crystalline and ASD systems. Calculated percent drug release vs time in c) ACP crystalline and ACP-PVP ASD, d) FNF crystalline, FNF-PVP ASD, and FNF-PVP-SDS ASD systems.
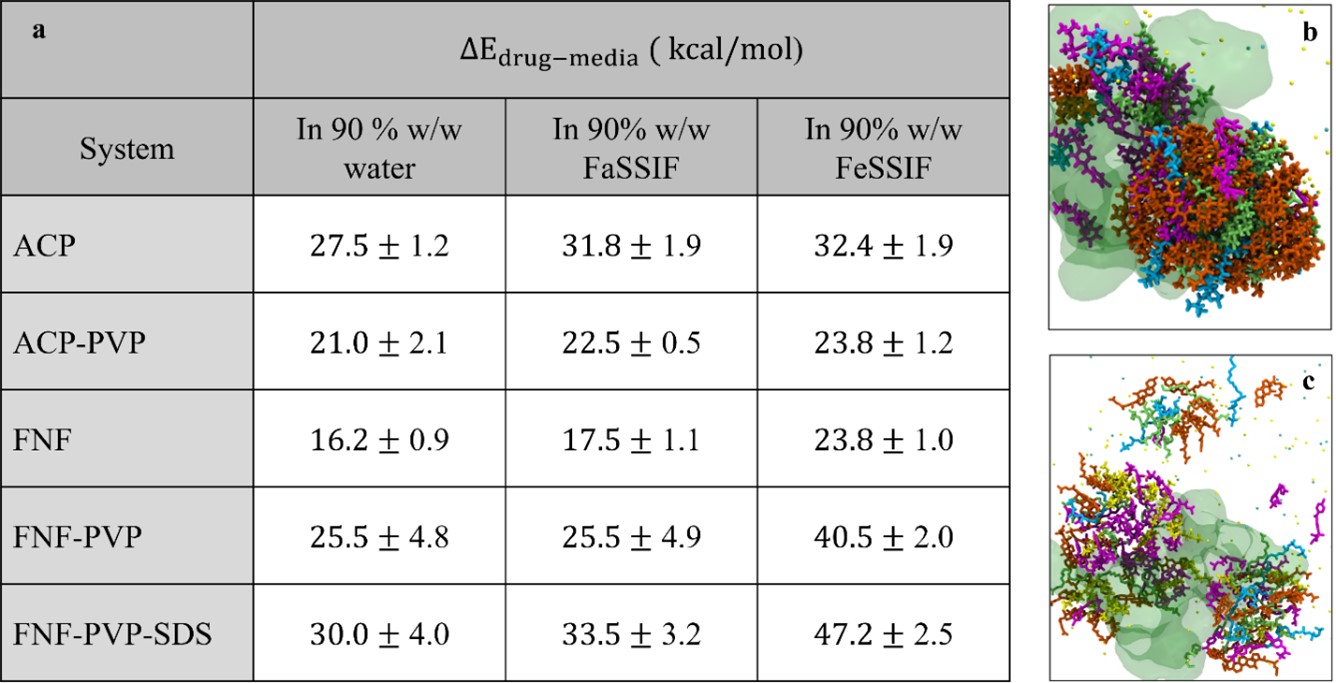 Figure 3: a) Drug-media interaction energy change with time in ACP crystalline, ACP-PVP ASD, FNF crystalline, FNF-PVP ASD, and FNF-PVP-SDS ASD systems. b) FNF-PVP ASD and c) FNF-PVP-SDS ASD trajectory snapshots in the FeSSIF phase demonstrate the formation of micellar-like aggregates. Coloring as follows: PVP (transparent green), FNF (purple), SDS (yellow), Na+ (yellow), Cl- (cyan) and digested forms of Glycodeoxycholate (orange, bile salt), palmitoyl lysophosphatidylcholine (light blue, phospholipids), and oleate (green, phospholipids).