
Manufacturing and Analytical Characterization - Chemical
Category: Late Breaking Poster Abstract
Clare Strachan, Ph.D.
University of Helsinki
Helsinki, Uusimaa, Finland
Oona Auvinen, M.S.
University of Helsinki
Helsinki, Uusimaa, Finland
Alba M. Arbiol Enguita, M.S.
University of Helsinki
Helsinki, Uusimaa, Finland
Teemu Tomberg, Ph.D.
University of Helsinki
Helsinki, Uusimaa, Finland
Lea Wurr
University of Helsinki
Helsinki, Uusimaa, Finland
Tom Konings, M.S.
University of Helsinki
Helsinki, Uusimaa, Finland
Leena Peltonen, Ph.D.
University of Helsinki
Helsinki, Uusimaa, Finland
Jukka Saarinen, Ph.D.
University of Helsinki
Helsinki, Uusimaa, Finland
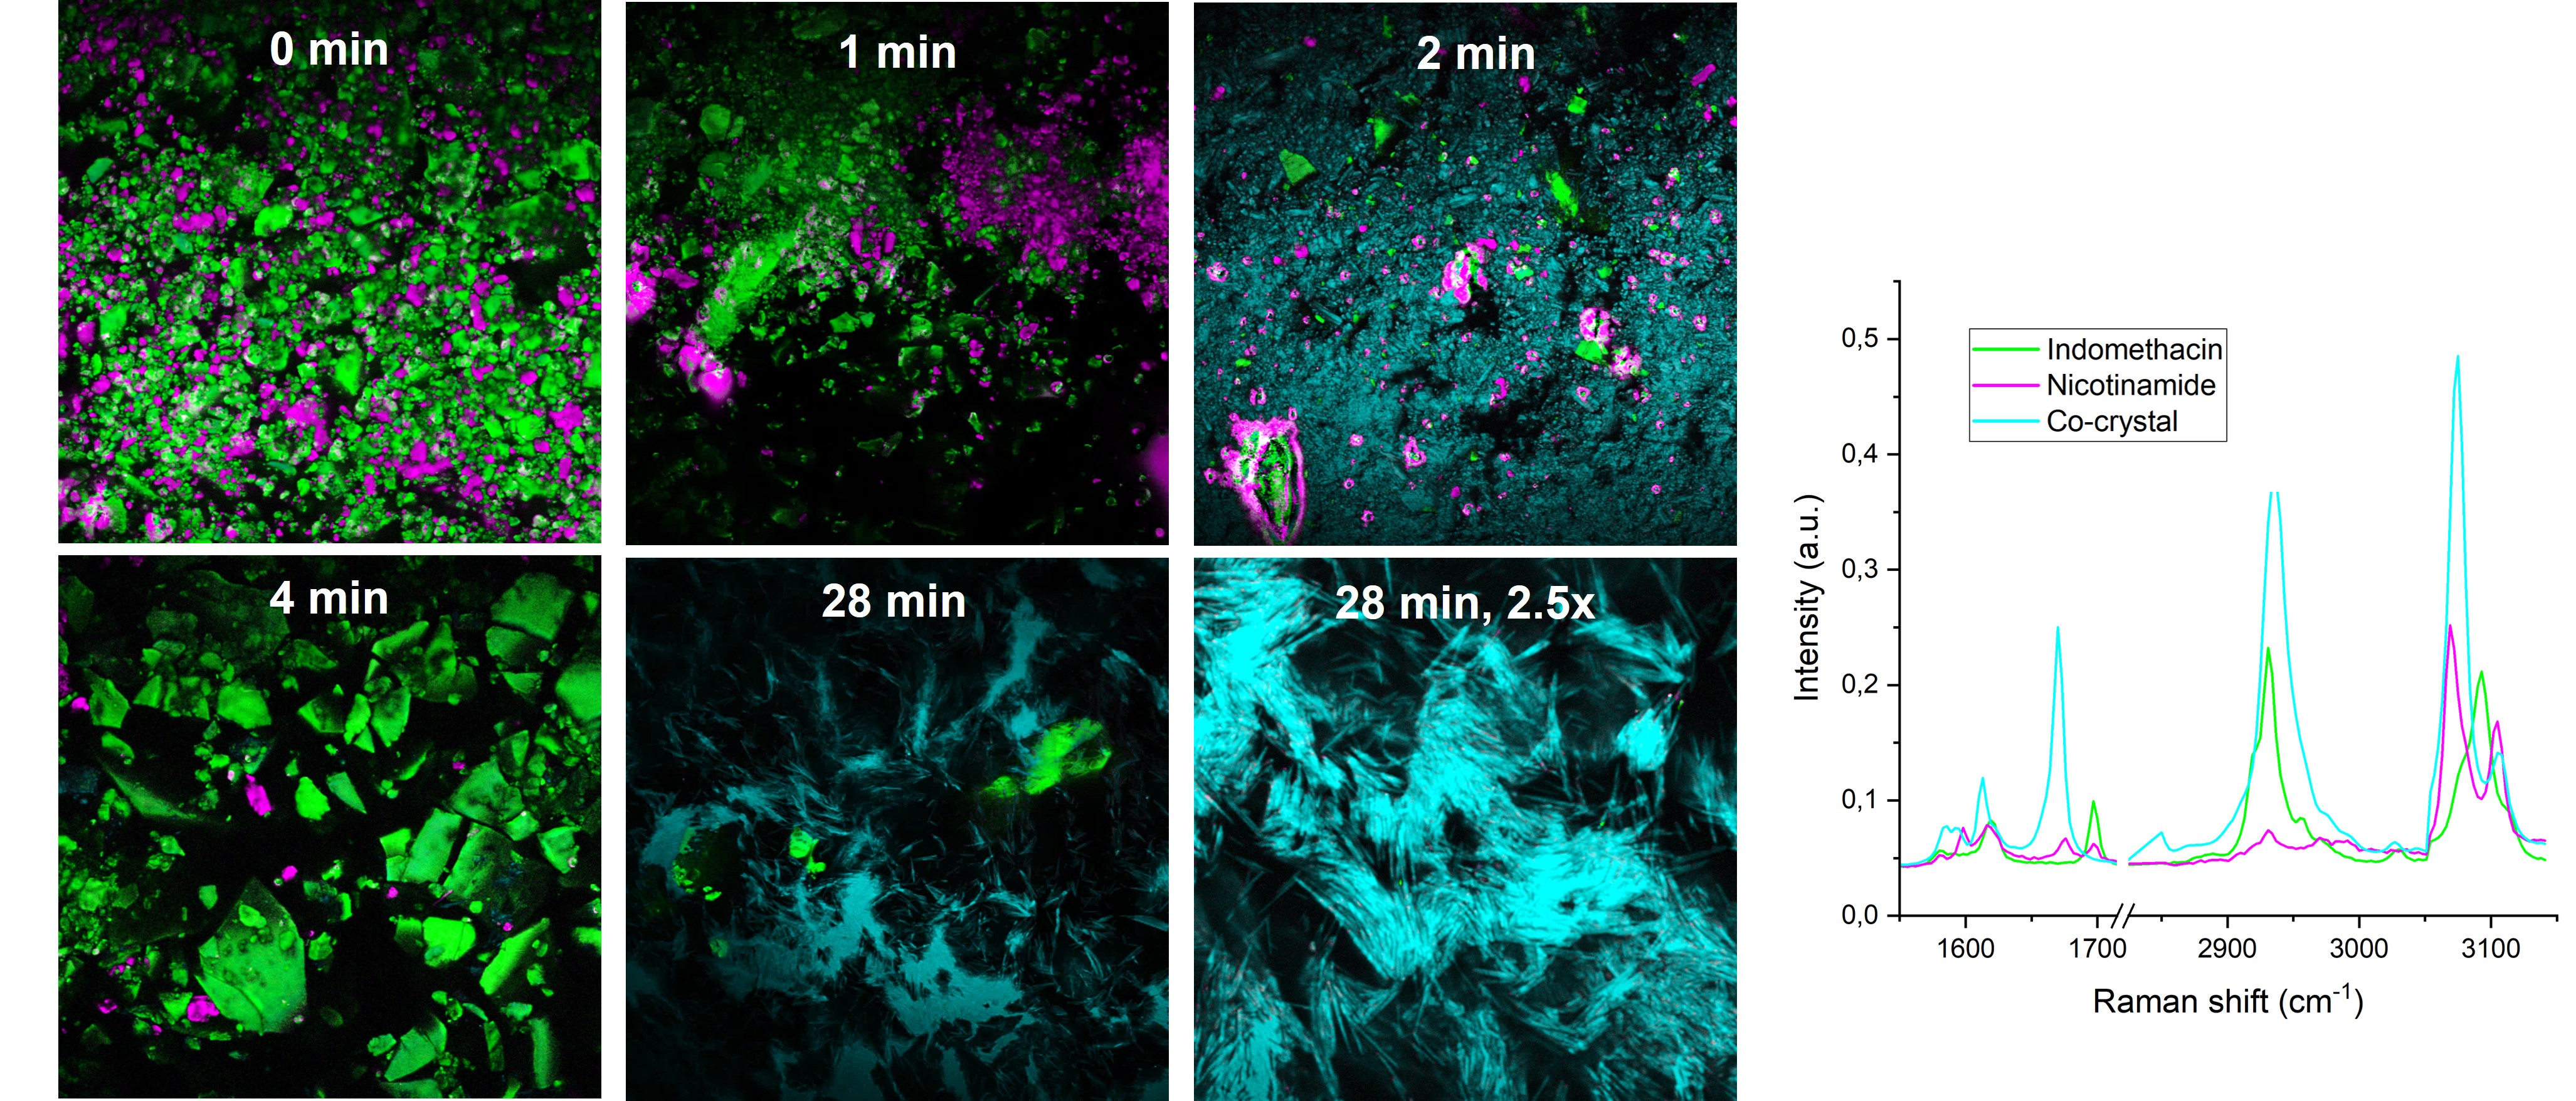 Figure 1. SRS images taken during co-crystallization of IND and NIC at different milling times. SRS spectra of the IND, NIC and the corresponding co-crystal are shown on the right. Images are generated from the SRS spectra using multivariate CLS analysis. The colors used to visualize the different forms in the images on the left correspond to the color of the spectra of the different components on the right. In the image at 2 min, some burning is also apparent in the sample. Each image (excluding the 2.5 x zoom) is 106 x 106 µm.