
Discovery and Basic Research
Category: Late Breaking Poster Abstract
Sol Shin
SungKyunKwan University
Suwon, Kyonggi-do, Republic of Korea
Sol Shin
SungKyunKwan University
Suwon, Kyonggi-do, Republic of Korea
Hyewon Ko
Korea Research Institute of Bioscience and Biotechnology
Suwon, Kyonggi-do, Republic of Korea
Joshua A. Jackman
SungKyunKwan University
Suwon, Kyonggi-do, Republic of Korea
Jae Hyung Park, Ph.D.
SungKyunKwan University
Suwon, Kyonggi-do, Republic of Korea
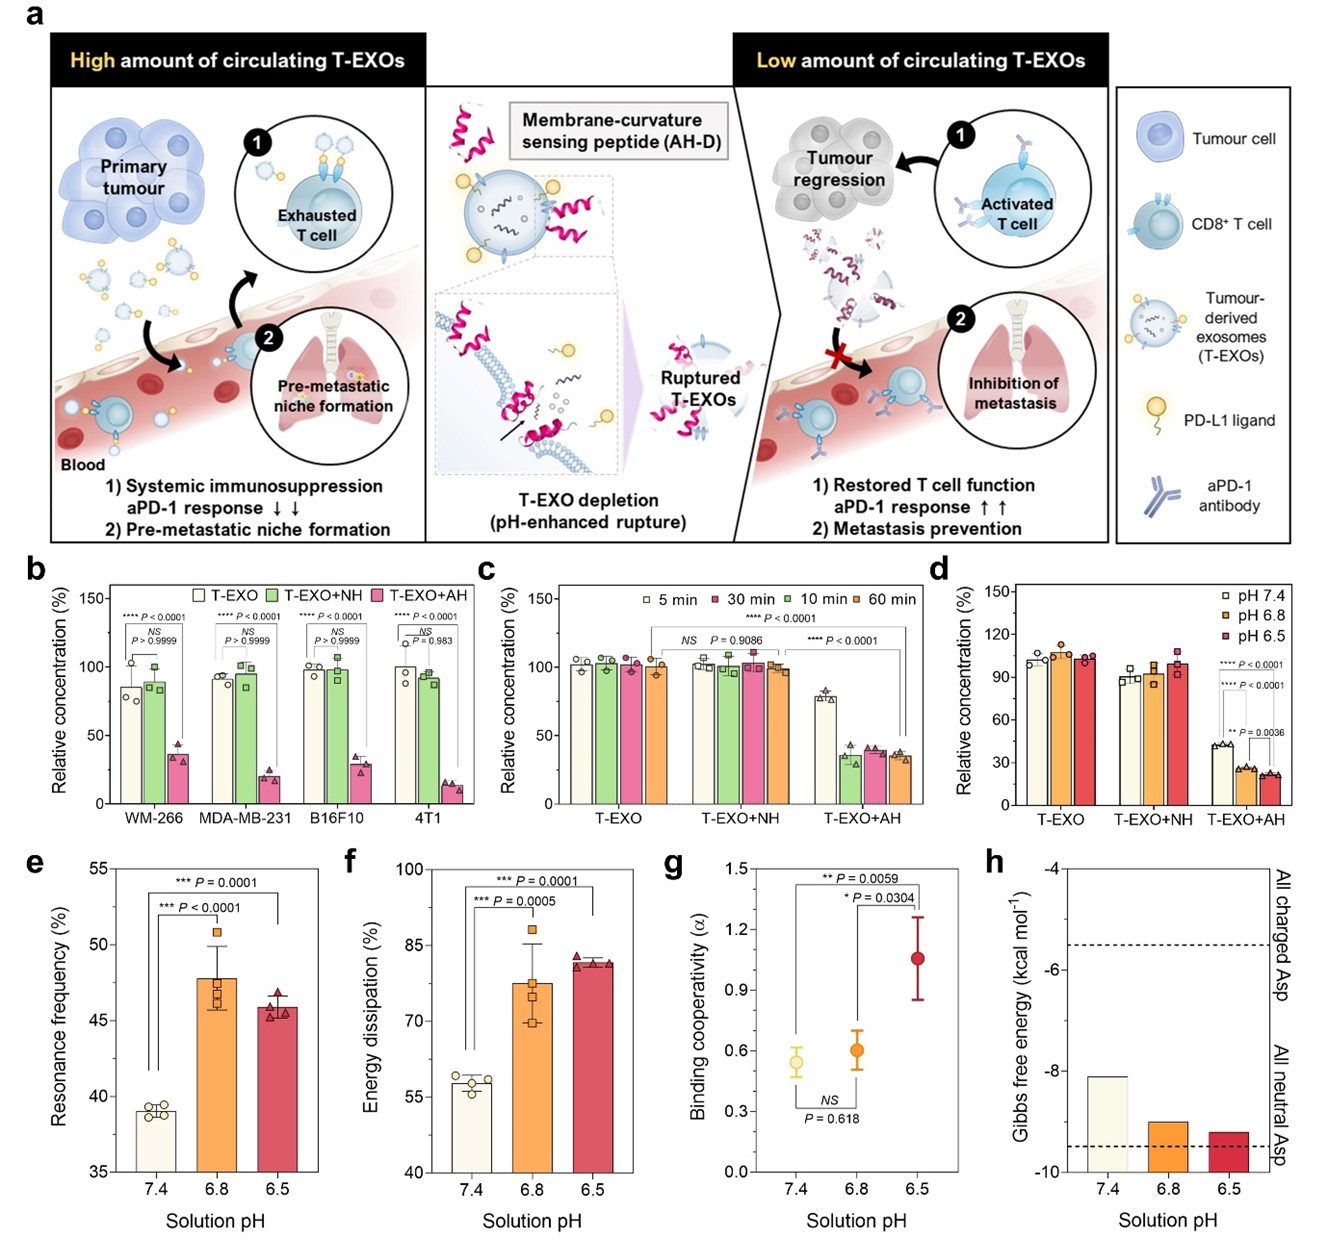 Fig. 1 | Repurposed antiviral AH-D peptide disrupts T-EXOs with enhanced activity in tumor pH conditions. a, Illustration of T-EXO depletion strategy. b, Nanoparticle tracking analysis (NTA) change in normalized number concentration of T-EXOs from human and murine cancer cells following T-EXO incubation with 1 μM AH-D or NH-D peptide for 10 min. WM-266, MDA-MB-231, B16F10, and 4T1 are human melanoma, human breast cancer, murine melanoma, and murine breast cancer cell lines, respectively. c-d, Corresponding NTA results for B16F10-derived T-EXOs following incubation with 1 μM AH-D or NH-D peptide for different time intervals (c) or for 5 min in different pH conditions (d). Results in b-d are reported as mean ± standard deviation (s.d.) (n=3 biological replicates, one-way analysis of variance (ANOVA)). e-f, Quartz crystal microbalance-dissipation (QCM-D) maximal changes in resonance frequency (e) and energy dissipation (f) signals following addition of 32 μM AH-D peptide to a layer of surface-adsorbed liposomes in different pH conditions. Results in e-f are reported as mean ± s.d. (n=4 biological replicates, one-way ANOVA). g, Binding cooperativity of AH-D peptide-induced liposomal membrane rupture in different pH conditions. Results are reported as best-fit values ± s.d. from least squares regression (n=16 biological replicates, extra sum-of-squares F tests between groups). h, Change in Gibbs free energy for membrane partitioning of AH-D peptide in different pH environments. Modelling is based on the Wimley-White interfacial hydrophobicity scale and dashed lines correspond to all charged (top) or all neutral (bottom) Asp residues in the peptide.
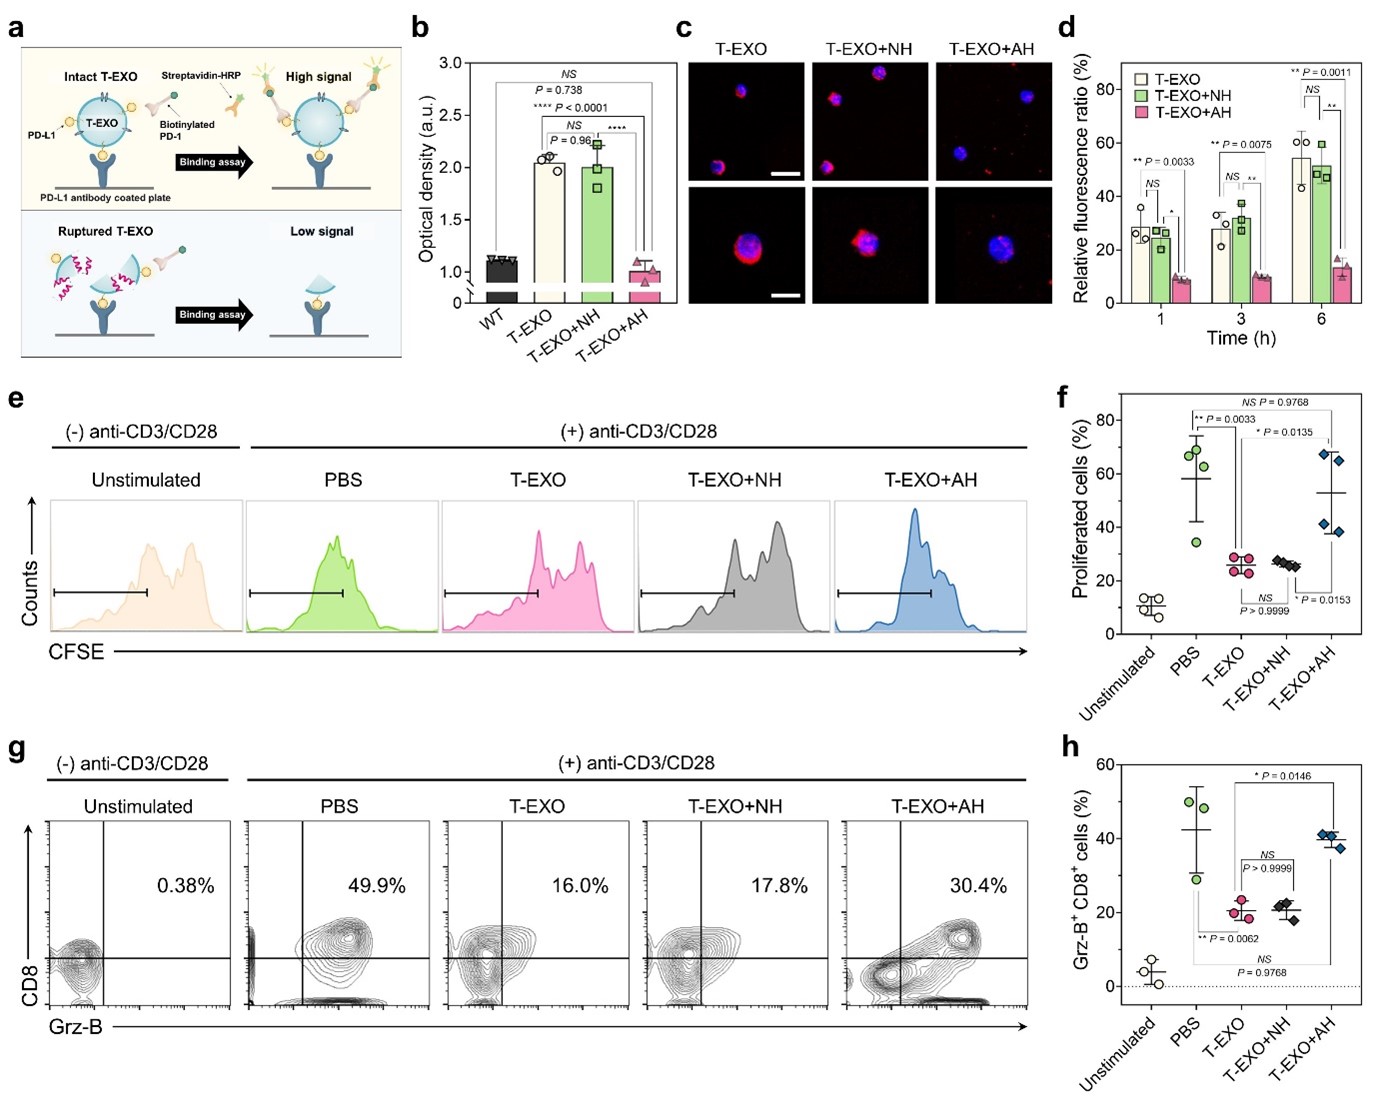 Fig. 2 | AH-D peptide prevents T-EXO-mediated CD8+ T cell dysfunction in vitro. a-b, PD-1 binding to exosomal PD-L1 by enzyme-linked immunosorbent assay (ELISA). Measurement concept (a) and PD-1 binding levels (b) to T-EXOs pretreated with AH-D or NH-D peptide (n=3 biological replicates, one-way ANOVA). T-EXOs and control exosomes were isolated from the plasma of B16F10 tumor-bearing and wild-type (WT) mice, respectively. c-h, Splenic naïve CD8+ T cells were stimulated with anti-CD3/CD28 antibodies. T-EXOs, without or with AH-D or NH-D peptide pretreatment, were added to stimulated T cells, followed by microscopy or flow cytometry analysis. Confocal microscopy images (c) of T cells after 3 h incubation with T-EXOs. Scale bars, 20 μm (upper) and 10 μm (lower). Blue, cell nuclei; Red, Cy5.5 dye-labelled T-EXOs. The images are representative of four independent experiments. Relative fluorescence intensity values (d) of T-EXO uptake by T cells at different time intervals. Representative flow cytometry plots (e) showing carboxyfluorescein succinimidyl ester (CFSE) dilution of CD8+ T cells and proportion (f) of CFSE-labelled CD8+ T cells. Representative flow cytometry plots after gating (g) and proportion (h) of activated CD8+ T cells that express granzyme B (Grz-B). Results in d, f, and h are reported as mean ± s.d. (n=3-4 biological replicates, one-way ANOVA).
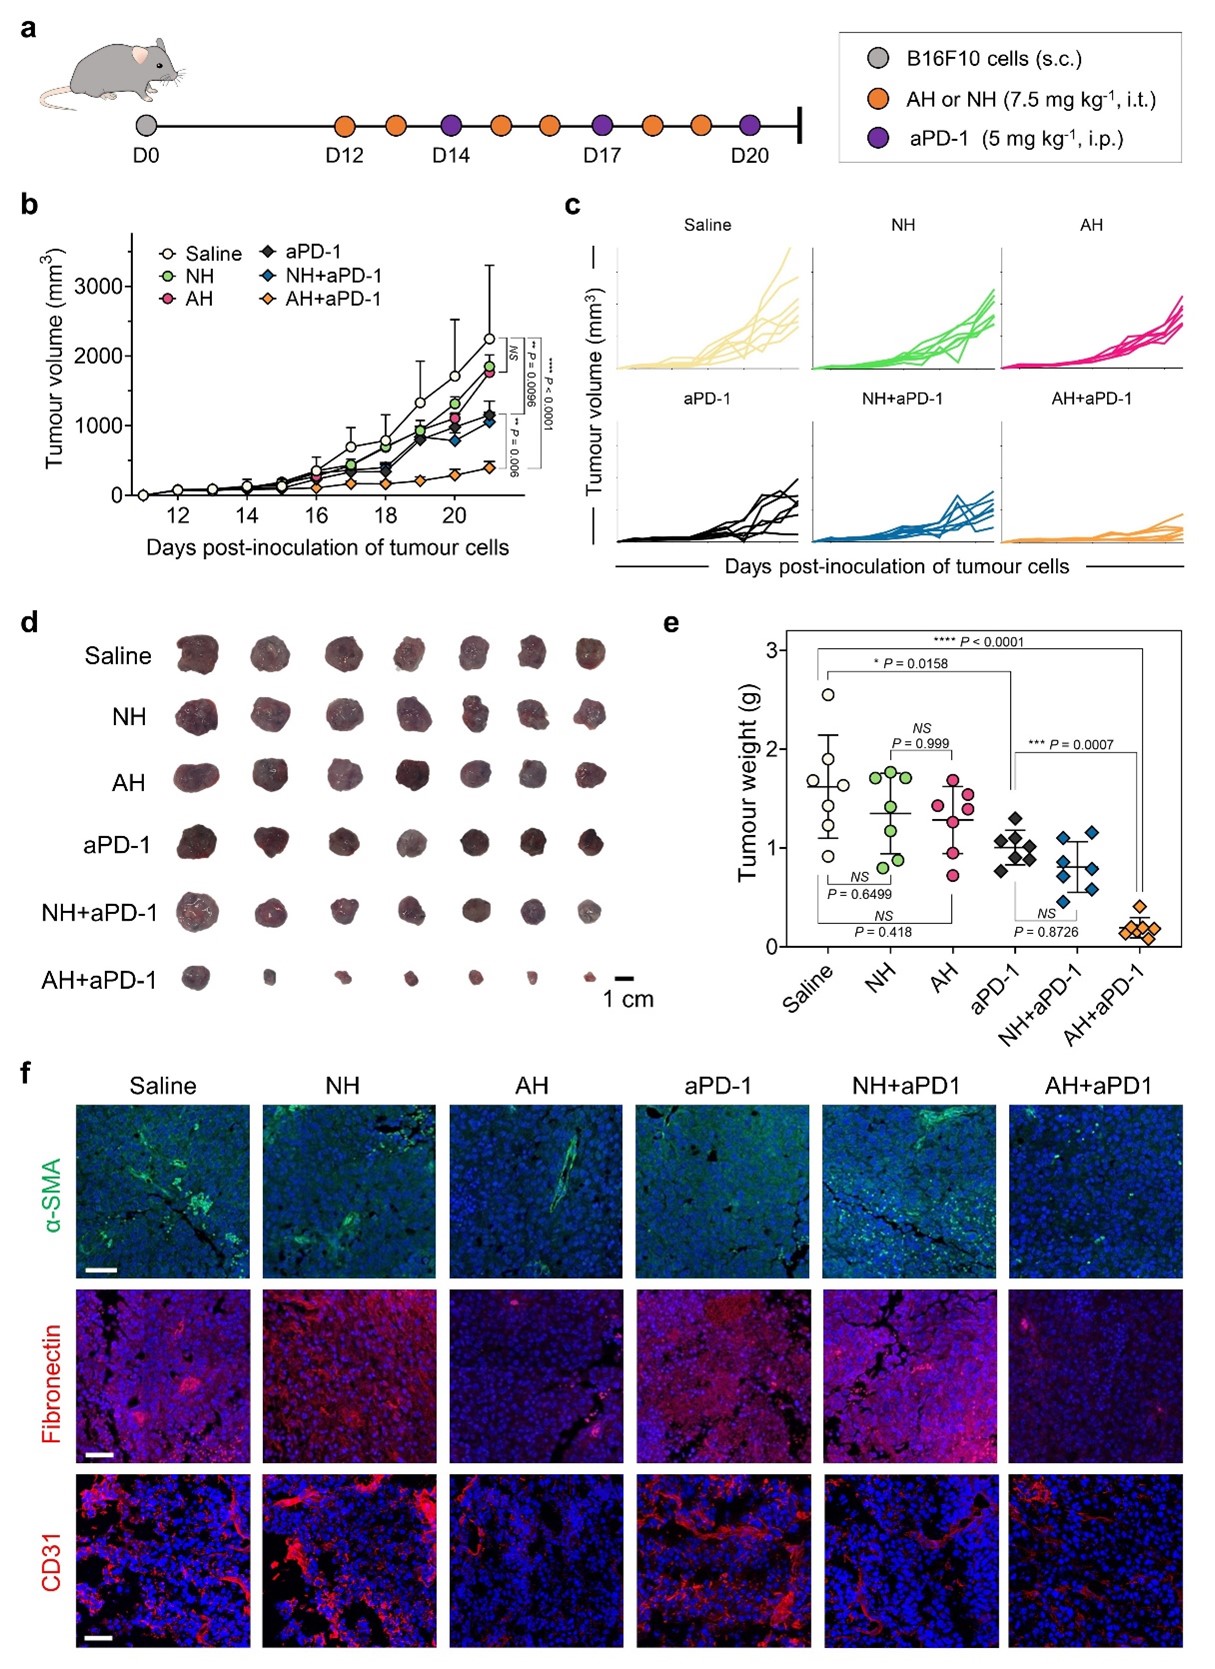 Fig. 3 | AH-D peptide enhances aPD-1 antibody therapy and reshapes tumor microenvironment in mice. a, B16F10 tumor-bearing C57BL/6 mice were treated with AH-D or NH-D peptide (7.5 mg kg-1 intratumoral), aPD-1 antibody (5 mg kg-1 intraperitoneal), or combinations thereof on selected days post-inoculation. b, Tumor volumes were measured starting day 12 post-inoculation and results are reported as mean ± s.d. (n=7 mice per group, one-way ANOVA). c, Tumor volumes of individual mice corresponding to the data in b. d-e, Representative pictures (d) and weights (e) of the excised tumors. Results in e are reported as mean ± s.d. (n=7 mice per group, one-way ANOVA). f, Immunofluorescence microscopy images of α-SMA, fibronectin, and CD31 in tumor tissues. Scale bar, 50 μm. Blue, cell nuclei. The images are representative of four independent experiments.