Manufacturing and Analytical Characterization - Biomolecular
Category: Late Breaking Poster Abstract
(T1430-09-56) Using Experimentally Validated ML Modeling to Predict the Thawing Time of Biologics During Large Scale Freeze-Thawing Cycles
- VN
Venkatraman Nagarajan (he/him/his)
University of Connecticut
Storrs, Connecticut, United States - VN
Venkatraman Nagarajan (he/him/his)
University of Connecticut
Storrs, Connecticut, United States - BC
Bodhisattwa Chaudhuri, Ph.D. (he/him/his)
University of Connecticut
Storrs, Connecticut, United States 
Tibo Duran, Ph.D. (he/him/his)
Researcher
Eli Lilly and Company
Storrs, Connecticut, United States- TM
Tanu Mehta, M.S.
University of Connecticut
Storrs, Connecticut, United States - BM
Bruna Minatovicz, Ph.D. (she/her/hers)
Janssen
Storrs, Connecticut, United States - LF
Lauren Fontana, Ph.D. (she/her/hers)
Sanofi
Framingham, Massachusetts, United States - YL
Yangchao Luo, Ph.D. (he/him/his)
University of Connecticut
Storrs, Connecticut, United States - YW
Yi Wang (she/her/hers)
University of Connecticut
Storrs, Connecticut, United States
Presenting Author(s)
Main Author(s)
Co-Author(s)
Purpose: Freezing and thawing (F/T) of bulk protein solutions is a common processing step used to maintain stability and high quality of biopharmaceutical products during development and production. Despite the advantages of freezing biologics, the freeze-thaw (F/T) process itself offers numerous challenges because of the poor understanding of how various process parameters affect the F/T of high concentration or viscous protein formulation. Therefore, it is imperative to better understand the mechanism and process impacts of F/T process for the development of optimized bulk F/T processes. The overall objective of this research is to develop an experimentally validated AI/ML model to predict the outcome of thawing experiment at different scales. First, a DOE based experimental approach is implemented to characterize F/T process by evaluation of different critical process parameters such as fill volume, concentration, solution viscosity and container configuration. Following that, the experimental results are used to develop an AI/ML model to predict the thawing time of large-scale biologics at different scales.
Methods: An Artificial Neural Network (ANN) based model is used to predict the thawing rates of biologics as ANN based models. Data driven ML models such as the ANN models, have been chosen as they perform well in the case of non-linear experimental data, and they also have the capability of extrapolating data to overcome the complexity and cost burden of experimental work. The input parameters such as solution viscosity, fill volume, loading distance between bottles while thawing, etc. were given to the supervised ANN model as input features and the thawing rate was extracted from the model as predictions.
Results: The goal of the experiments was to calculate the thawing rates of protein surrogates such as PEGs, which can be used to train the ANN models. Solutions with different viscosities were prepared by dissolving PEG in ultra-pure water at suitable concentrations. The solutions were stored in square polycarbonate bottles, frozen in a -80°C refrigerator for 24 hours and thawed afterwards. Thawing rates (°C/min) were calculated based on temperature differences between the starting and ending points of experiments and the time taken to reach the end points from the starting points. The starting point of the experiments was the beginning of the thawing process. Two different ending points were chosen for the experiments. The first end point was the disappearance of visible ice in the bottles and the second point was the solution temperature reaching 15°C. As for the ANN model, Mean Relative Errors (MREs) and Mean Squared Errors (MSEs) between the target thawing rates and predicted thawing rates were calculated for performance evaluation.
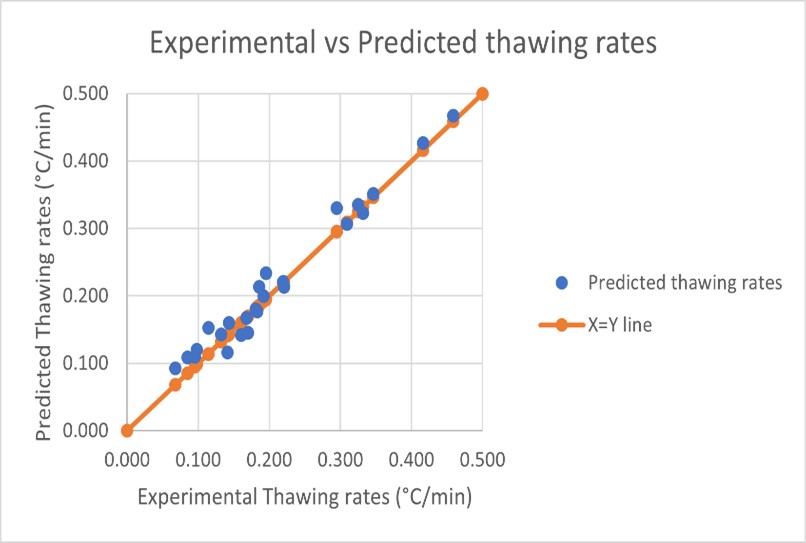
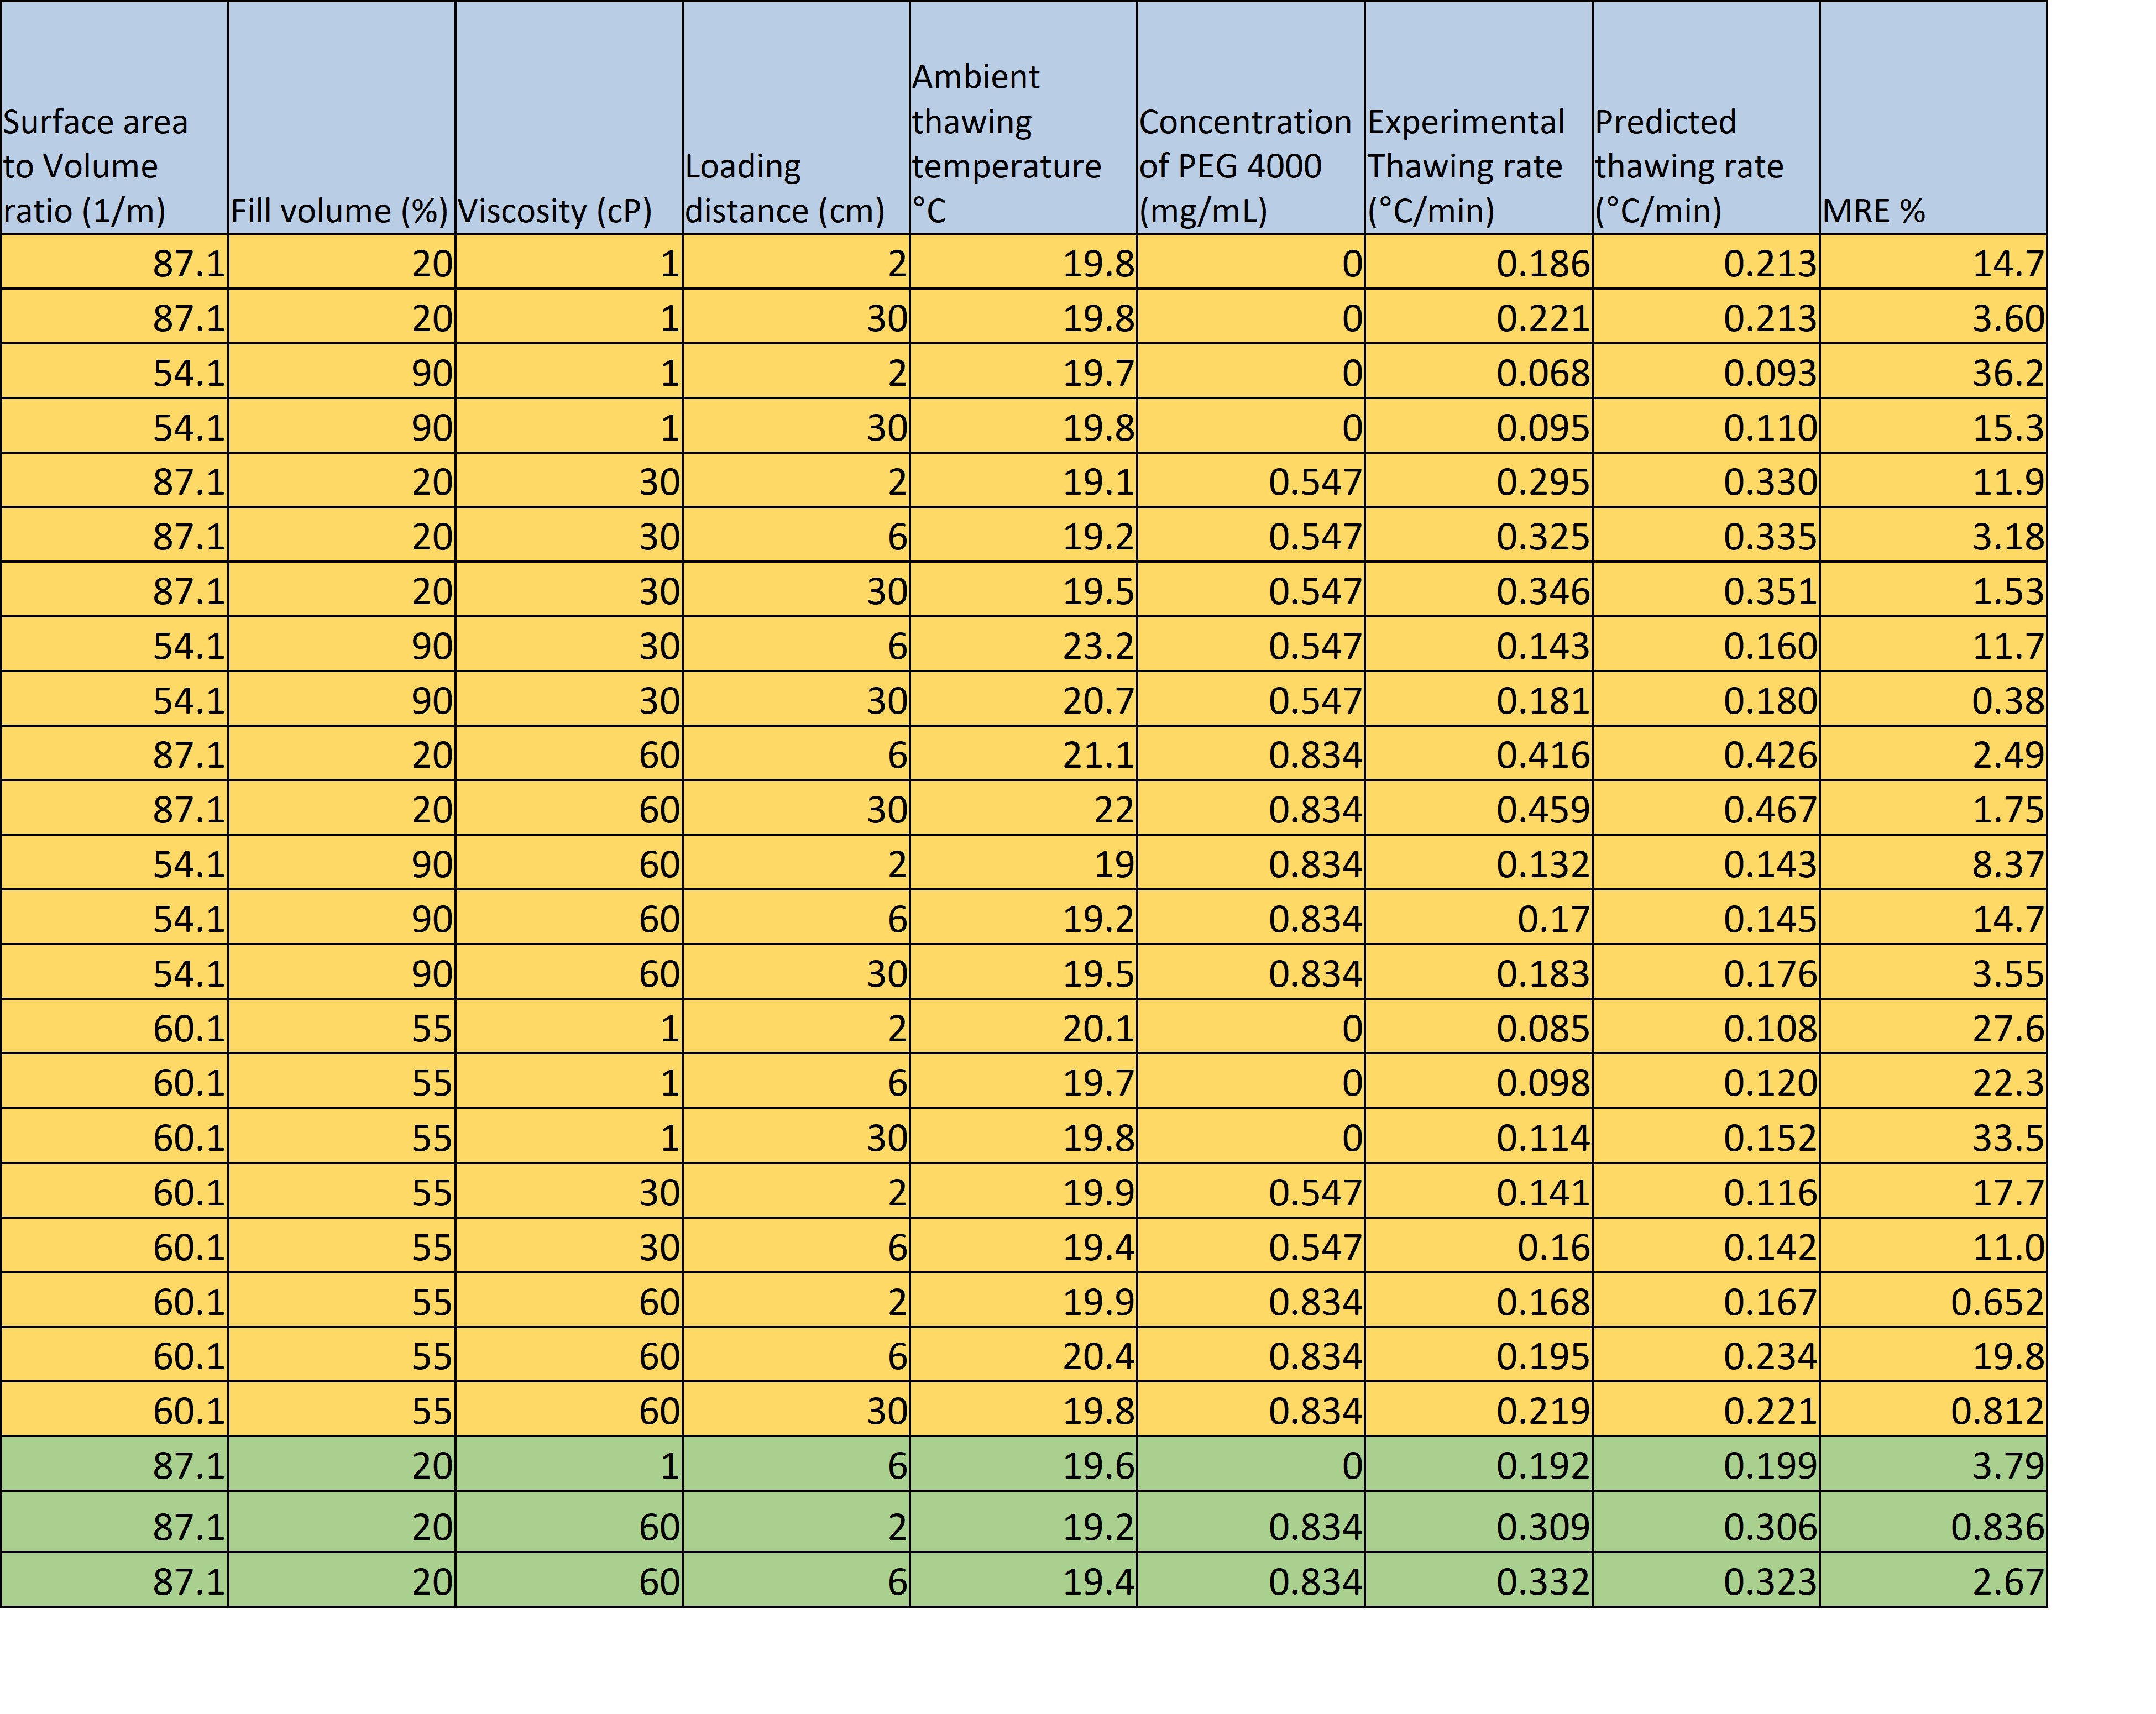
Conclusion: The ML data set was divided into testing and training sets. The mean relative error calculated based on the difference between the predicted and experimental thawing rate for the testing set was less than 4%.
 Calculated thawing rates of the l F/T studies for 90% fill volume at single loading configuration(a), 2cm(b) and 6cm(c) respectively. Thawing rate is plotted as a function of surrogate viscosity (cP) and thawing temperature (°C). Orange bars represent 1cp cases, grey bars represent 30cP cases and blue bars represent 60cP cases.
  ANN model prediction results of thawing rates calculated using the temperature values recorded from experimental studies.
 Tabulated results of thawing rate predictions from the developed ANN model. The last 3 rows (highlighted in green) were used for testing while the remaining rows (highlighted in light brown) were used to train the model. The error percentage which was calculated from the observed experimental thawing rate and predicted thawing rate are shown in the MRE column (Mean Relative Error).