
Bioanalytics - Biomolecular
Category: Late Breaking Poster Abstract
Shashank Kosuri, Ph.D. (he/him/his)
Secant Group
Hatfield, Pennsylvania, United States
Shashank Kosuri, Ph.D. (he/him/his)
Secant Group
Hatfield, Pennsylvania, United States
Neha Chauhan, Ph.D.
Secant Group
Telford, Pennsylvania, United States
Stephanie Reed, Ph.D.
Secant Group
Telford, Pennsylvania, United States
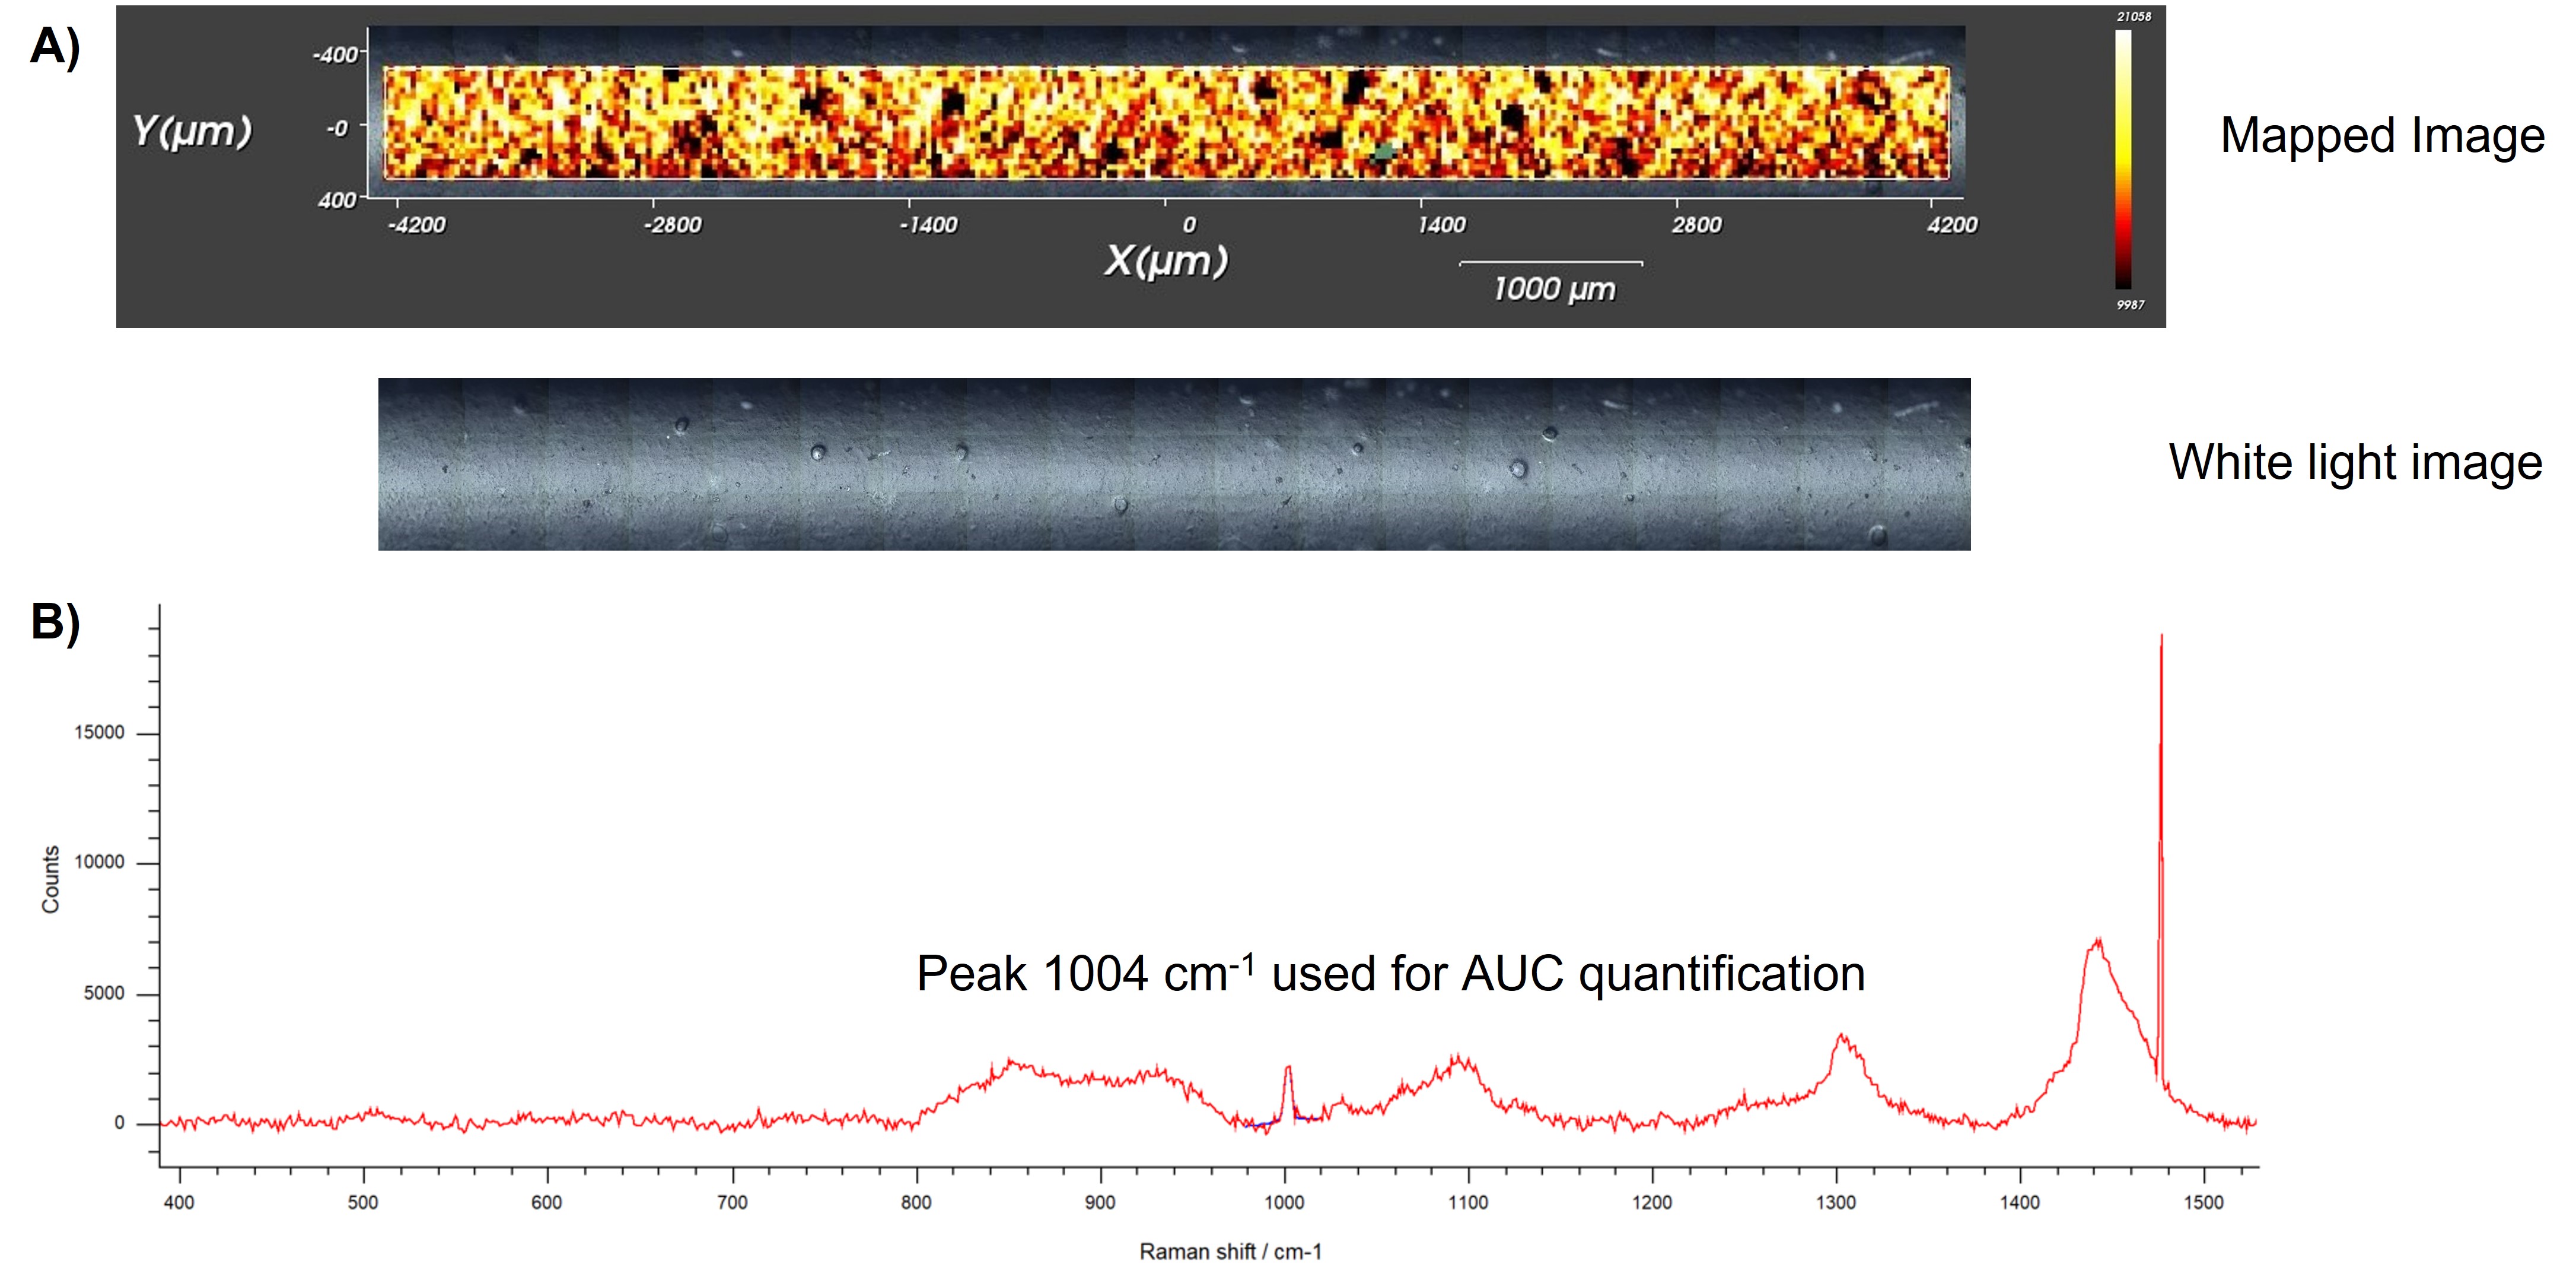 Figure 1. A) Heat map showing the distribution of BSA on the surface of the plant. Corresponding white light image is also shown. B) Raman spectrum of a point on the surface showing the peak that was used for quantification.
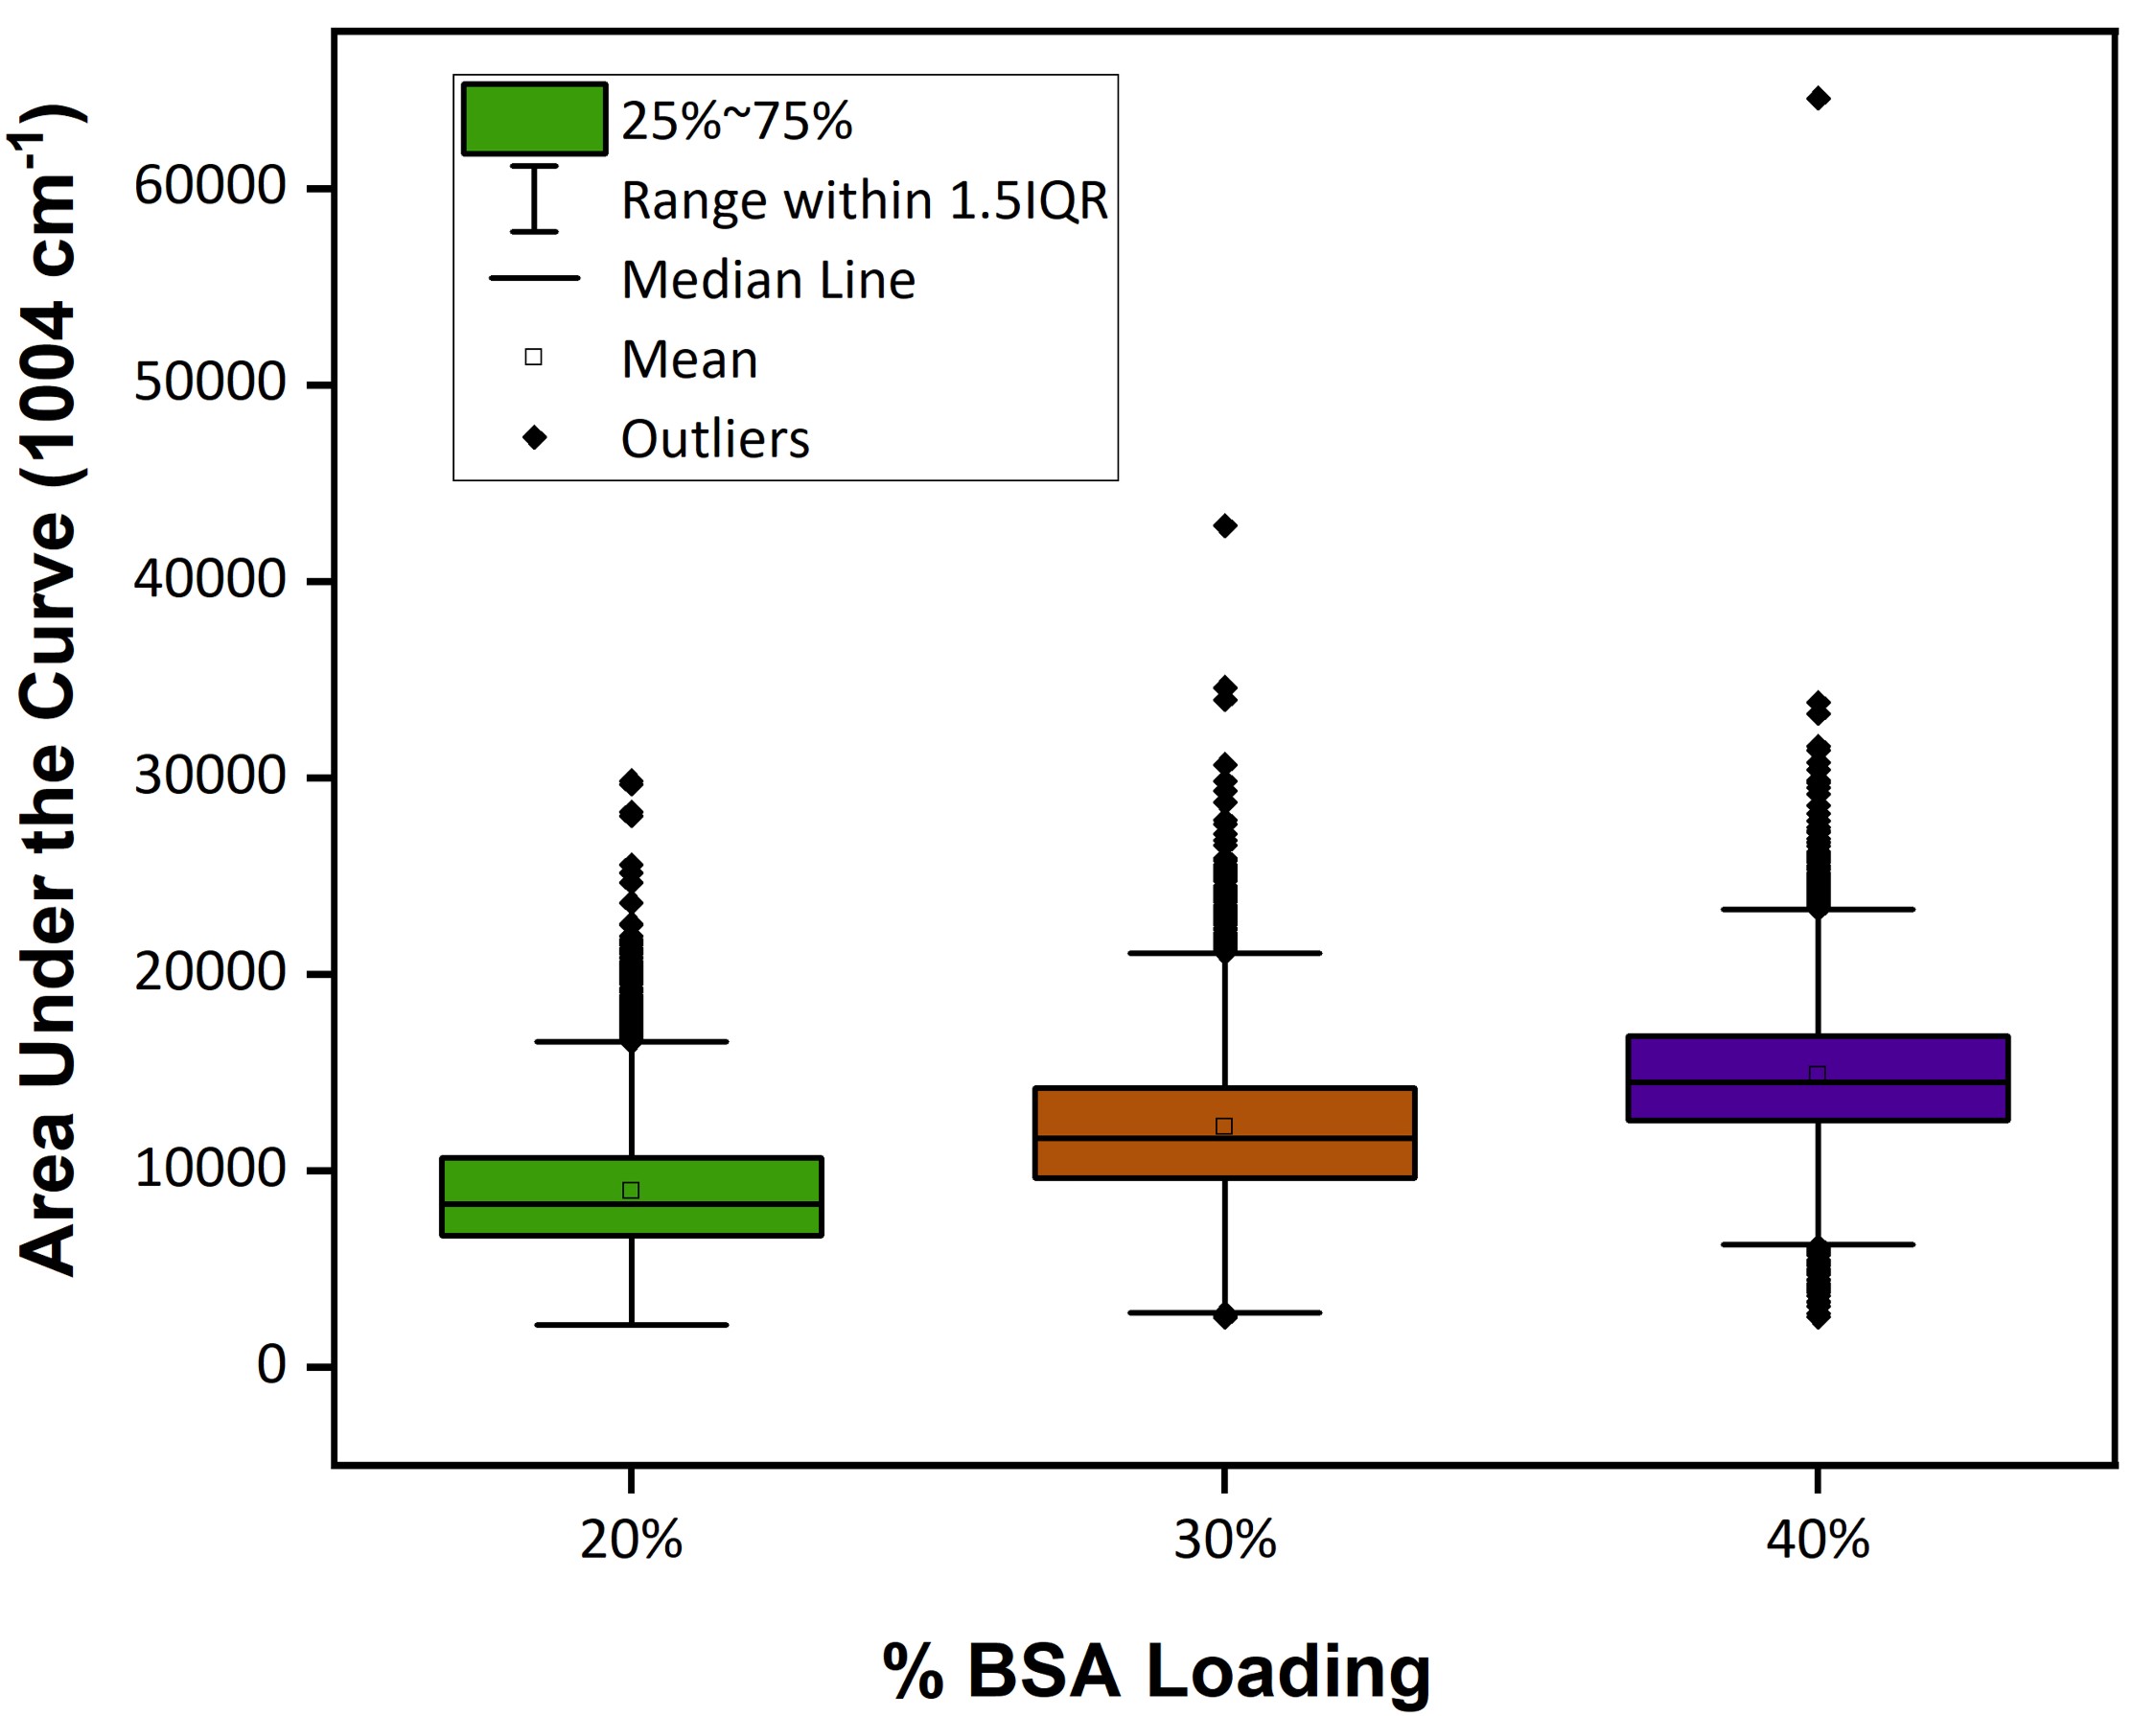 Figure 2. Box plot showing the distribution of AUCs of all points collected on the surface for three different formulations. Mean and median values for the different loadings are shown.