
Manufacturing and Analytical Characterization - Chemical
Category: Late Breaking Poster Abstract

Phillip Yawman, B.S.
Senior Application Scientist
DigiM Solution LLC
Woburn, Massachusetts, United States
Phillip Yawman, B.S.
Senior Application Scientist
DigiM Solution LLC
Woburn, Massachusetts, United States
Paul Stroud, Ph.D.
Eli Lilly and Company
Indianapolis, Indiana, United States
Michael Johnson, M.S.
Eli Lilly and Company
Indianapolis, Indiana, United States
Lexie Niemoeller, Ph.D.
Eli Lilly and Company
Indianapolis, Indiana, United States
 photo")
Shawn Zhang, Ph.D. (he/him/his)
Managing Partner
DigiM Solution LLC
Woburn, Massachusetts, United States
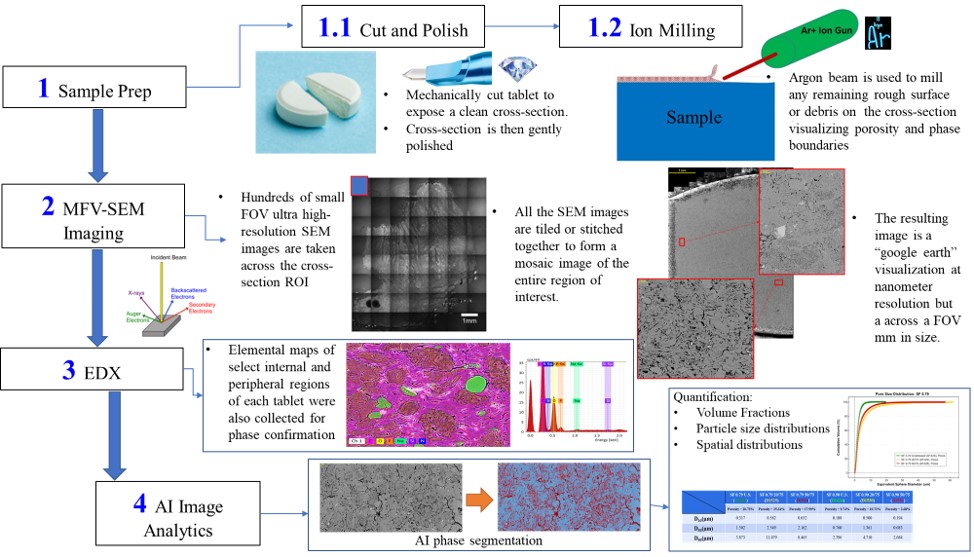 Figure 1. Imaging and spectroscopy-based tablet analysis workflow
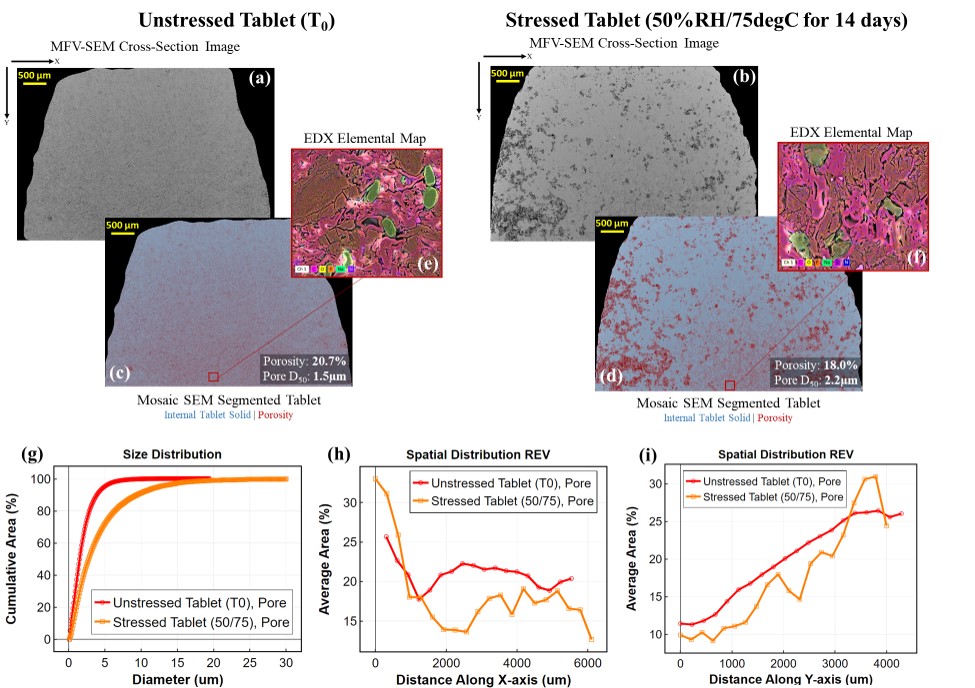 Figure 2.: (a,b) MFV-SEM Grayscale Images of an unstressed and stressed tablet, respectively. (c,d) Corresponding images with AI-based segmentation overlay. (e,f) EDS elemental map of regions of interest for each tablet. (g) Image-based cumulative pore size distribution plot. (h) Image-based pore spatial distribution along the X axis of the tablet images. (i) Image-based pore spatial distribution along the Y axis of the tablet images.