
Manufacturing and Analytical Characterization - Chemical
Category: Late Breaking Poster Abstract

Simon Schulte Herbrueggen
Doctoral Candidate
University of Hamburg
Hamburg, Hamburg, Germany
Simon Schulte Herbrueggen
Doctoral Candidate
University of Hamburg
Hamburg, Hamburg, Germany
Anna Novikova
Fette Compacting GmbH
Schwarzenbek, Schleswig-Holstein, Germany
Claudia Leopold
University of Hamburg
Hamburg, Hamburg, Germany
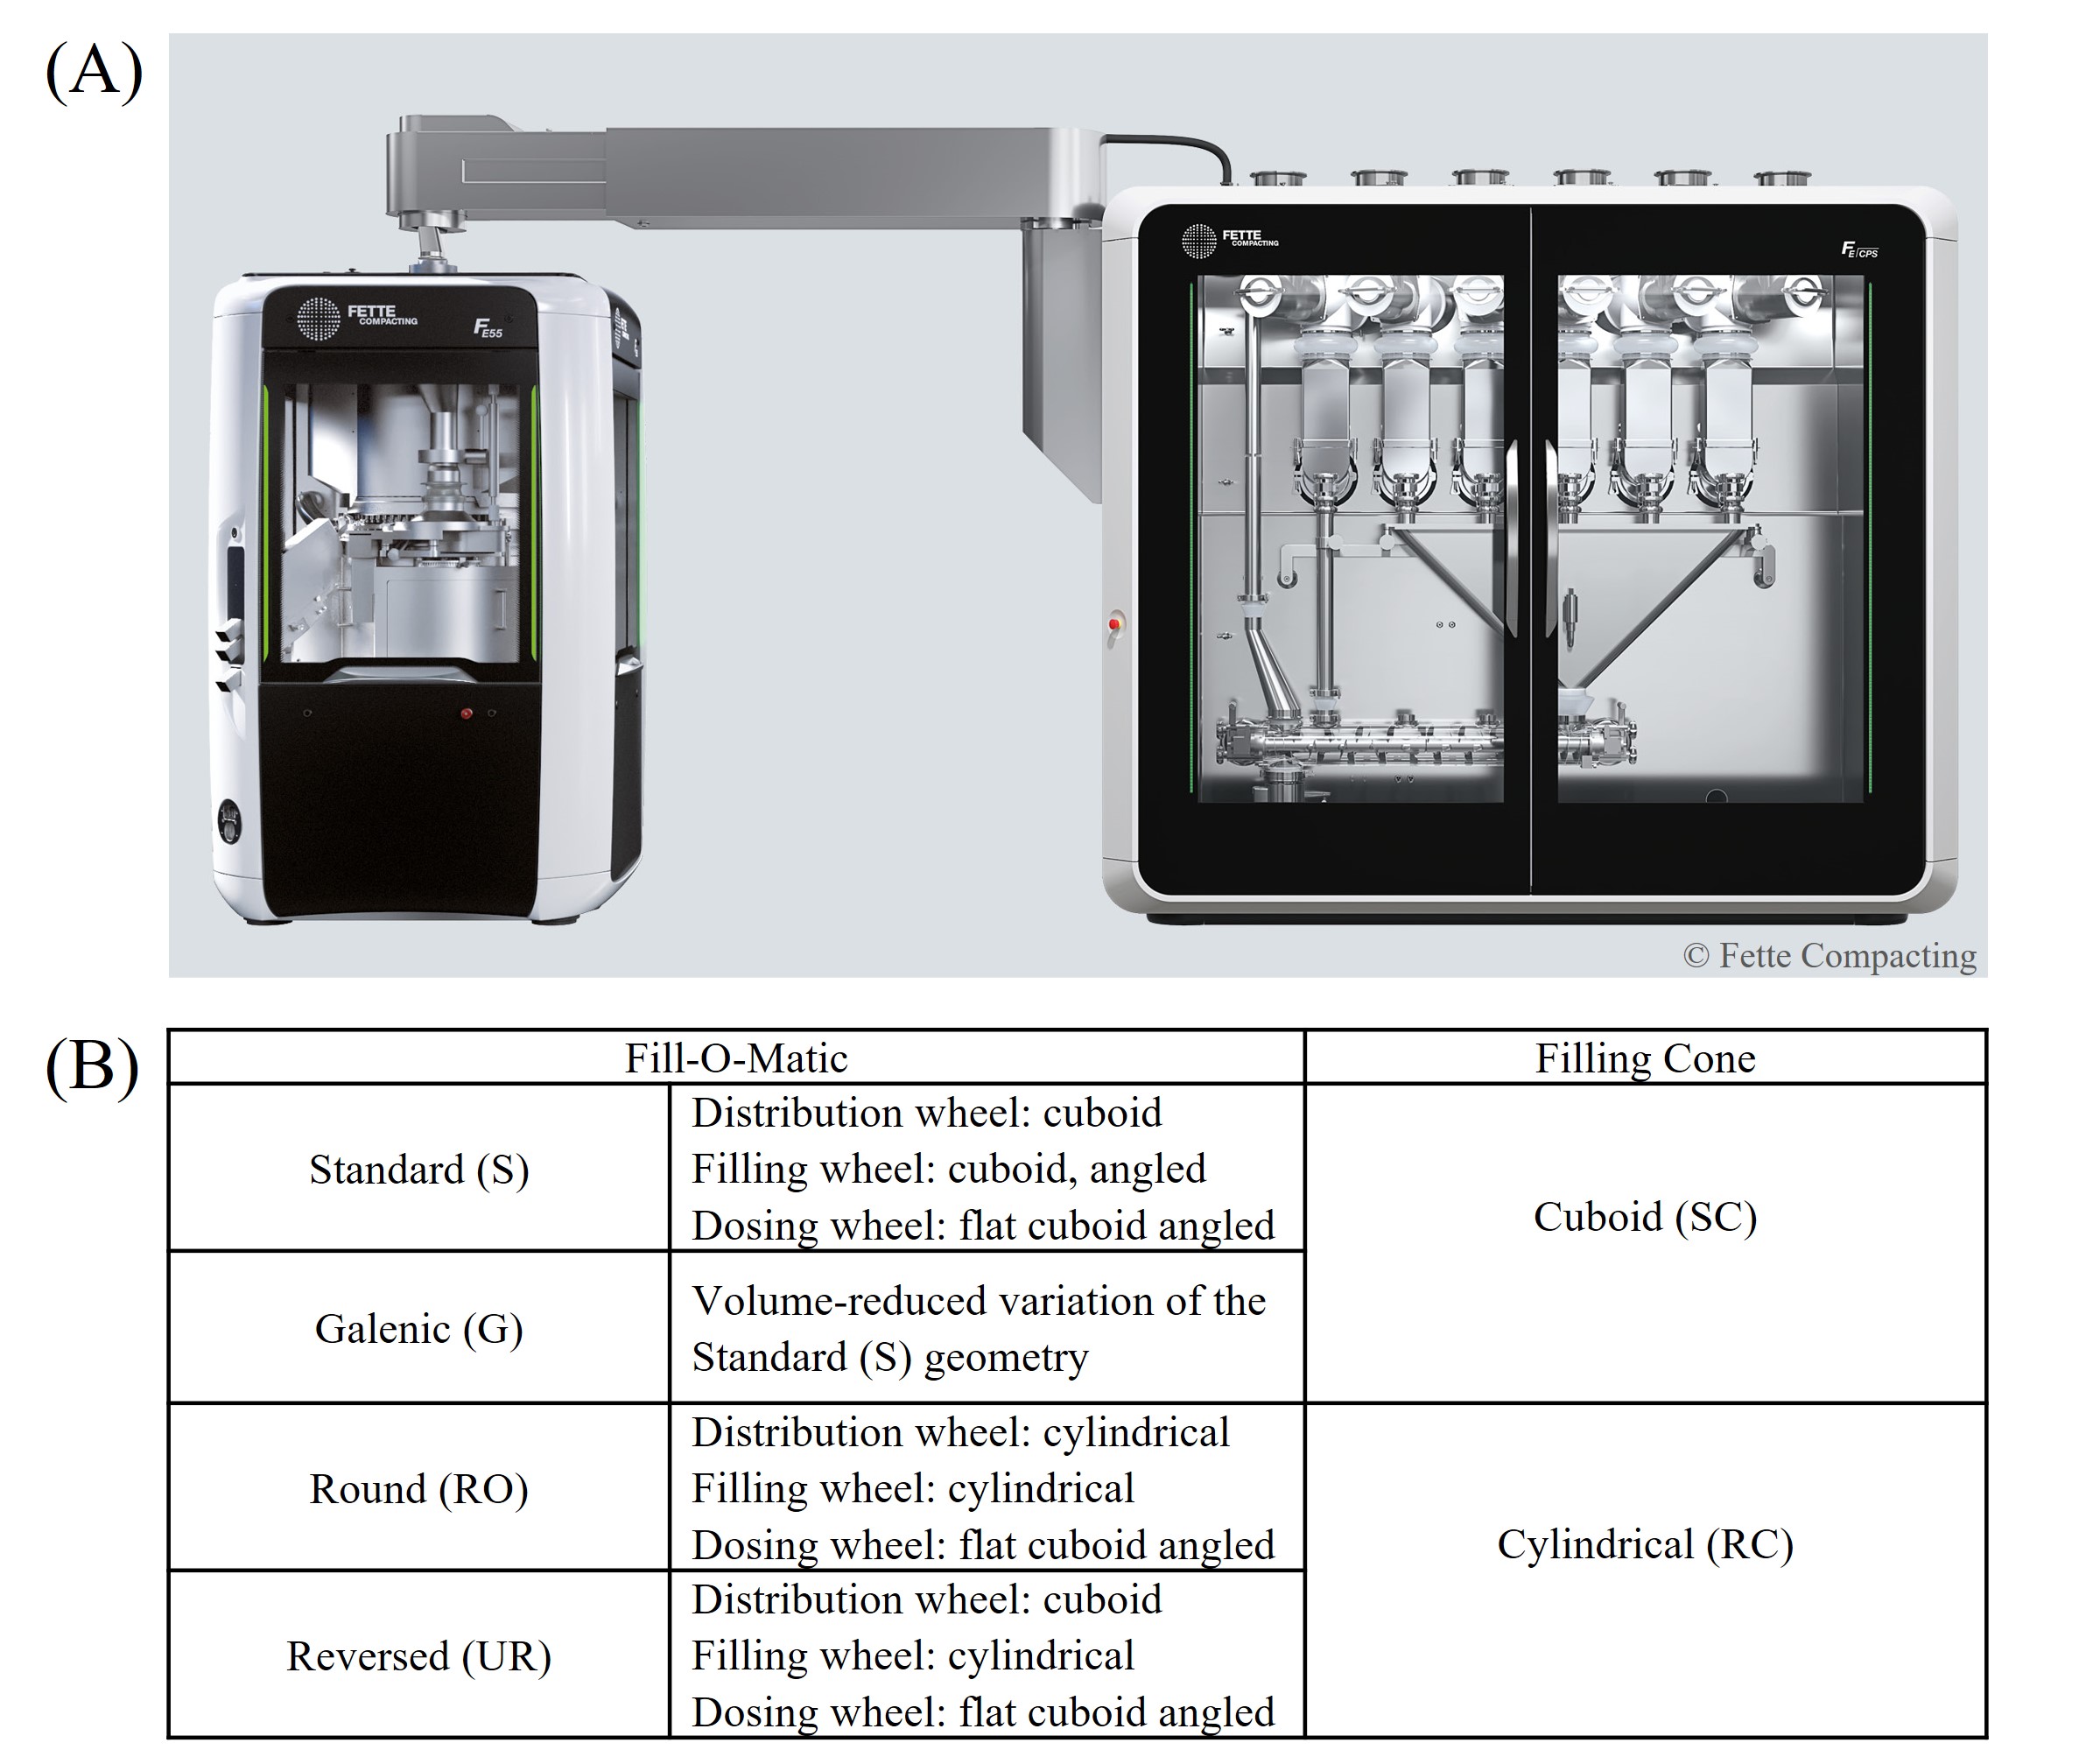 Fig. 1: (A) Continuous Processing System FE CPS; (B) Schematic representation of the filling devices geometries (UR is operated with reversed rotational direction of the distribution and filling wheel).
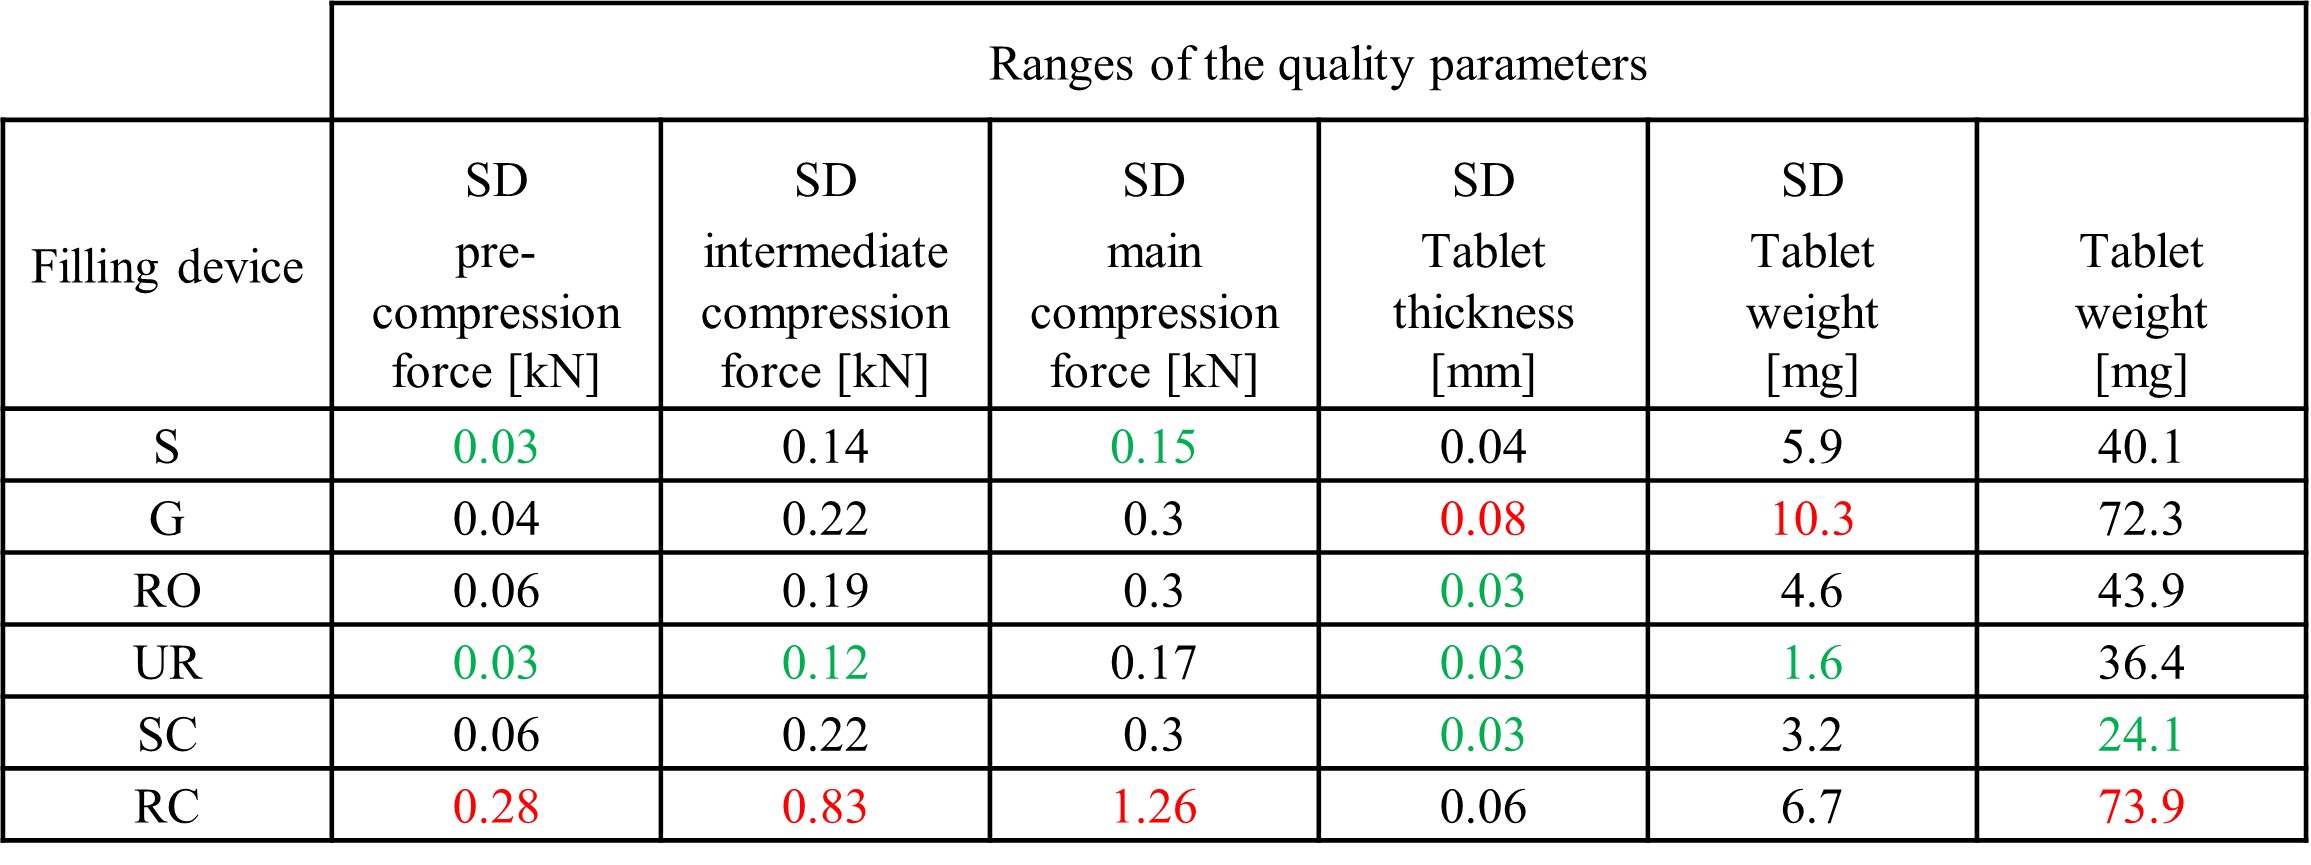 Table 1: Ranges of the quality parameters for each filling device. The lowest range is displayed in green, the highest range in red. SD: Standard deviation
 .jpg) Fig. 2: Principal component analysis (PCA). (A) Loadings and Scores Plot. (B) Scores Plot: Design center points at 55 rpm turret speed, 61 rpm filling device speed, 2.5 mm overfill. (C) Scores Plot: UR/SC/S geometries at 100 rpm turret speed, 130 rpm filling device speed, 2.5 mm overfill (100 | 130 | 2.5 UR/SC/S); SC geometry at 100 rpm turret speed, 91 rpm filling device speed, 0.5 mm overfill (100 | 91 | 0.5 SC). (D) Scores Plot: UR geometry at 100 rpm turret speed, 130 rpm filling device speed, 2.5 mm overfill (100 | 130 | 2.5 UR); 100 rpm turret speed, 110 rpm filling device speed, 4.5 mm overfill (100 | 110 | 4.5 UR); 100 rpm turret speed, 90 rpm filling device speed, 2.5 mm overfill (100 | 90 | 2.5 UR).
Fig. 2: Principal component analysis (PCA). (A) Loadings and Scores Plot. (B) Scores Plot: Design center points at 55 rpm turret speed, 61 rpm filling device speed, 2.5 mm overfill. (C) Scores Plot: UR/SC/S geometries at 100 rpm turret speed, 130 rpm filling device speed, 2.5 mm overfill (100 | 130 | 2.5 UR/SC/S); SC geometry at 100 rpm turret speed, 91 rpm filling device speed, 0.5 mm overfill (100 | 91 | 0.5 SC). (D) Scores Plot: UR geometry at 100 rpm turret speed, 130 rpm filling device speed, 2.5 mm overfill (100 | 130 | 2.5 UR); 100 rpm turret speed, 110 rpm filling device speed, 4.5 mm overfill (100 | 110 | 4.5 UR); 100 rpm turret speed, 90 rpm filling device speed, 2.5 mm overfill (100 | 90 | 2.5 UR).