
Formulation and Delivery - Biomolecular
Category: Late Breaking Poster Abstract
 photo")
Haixi Cui, B.S. (he/him/his)
PhD candidate
University of Maryland Baltimore
Baltimore, Maryland, United States
Haixi Cui, B.S. (he/him/his)
PhD candidate
University of Maryland Baltimore
Baltimore, Maryland, United States
Haixi Cui, B.S. (he/him/his)
PhD candidate
University of Maryland Baltimore
Baltimore, Maryland, United States
Hua Yu, Ph.D. (she/her/hers)
FZata
Halethorpe, Maryland, United States
Zhiyong Yang, Ph.D. (she/her/hers)
FZata
Halethorpe, Maryland, United States
Hanping Feng, Ph.D. (he/him/his)
FZata
Halethorpe, Maryland, United States
Stephen Hoag, Ph.D. (he/him/his)
University of Maryland
Baltimore, Maryland, United States
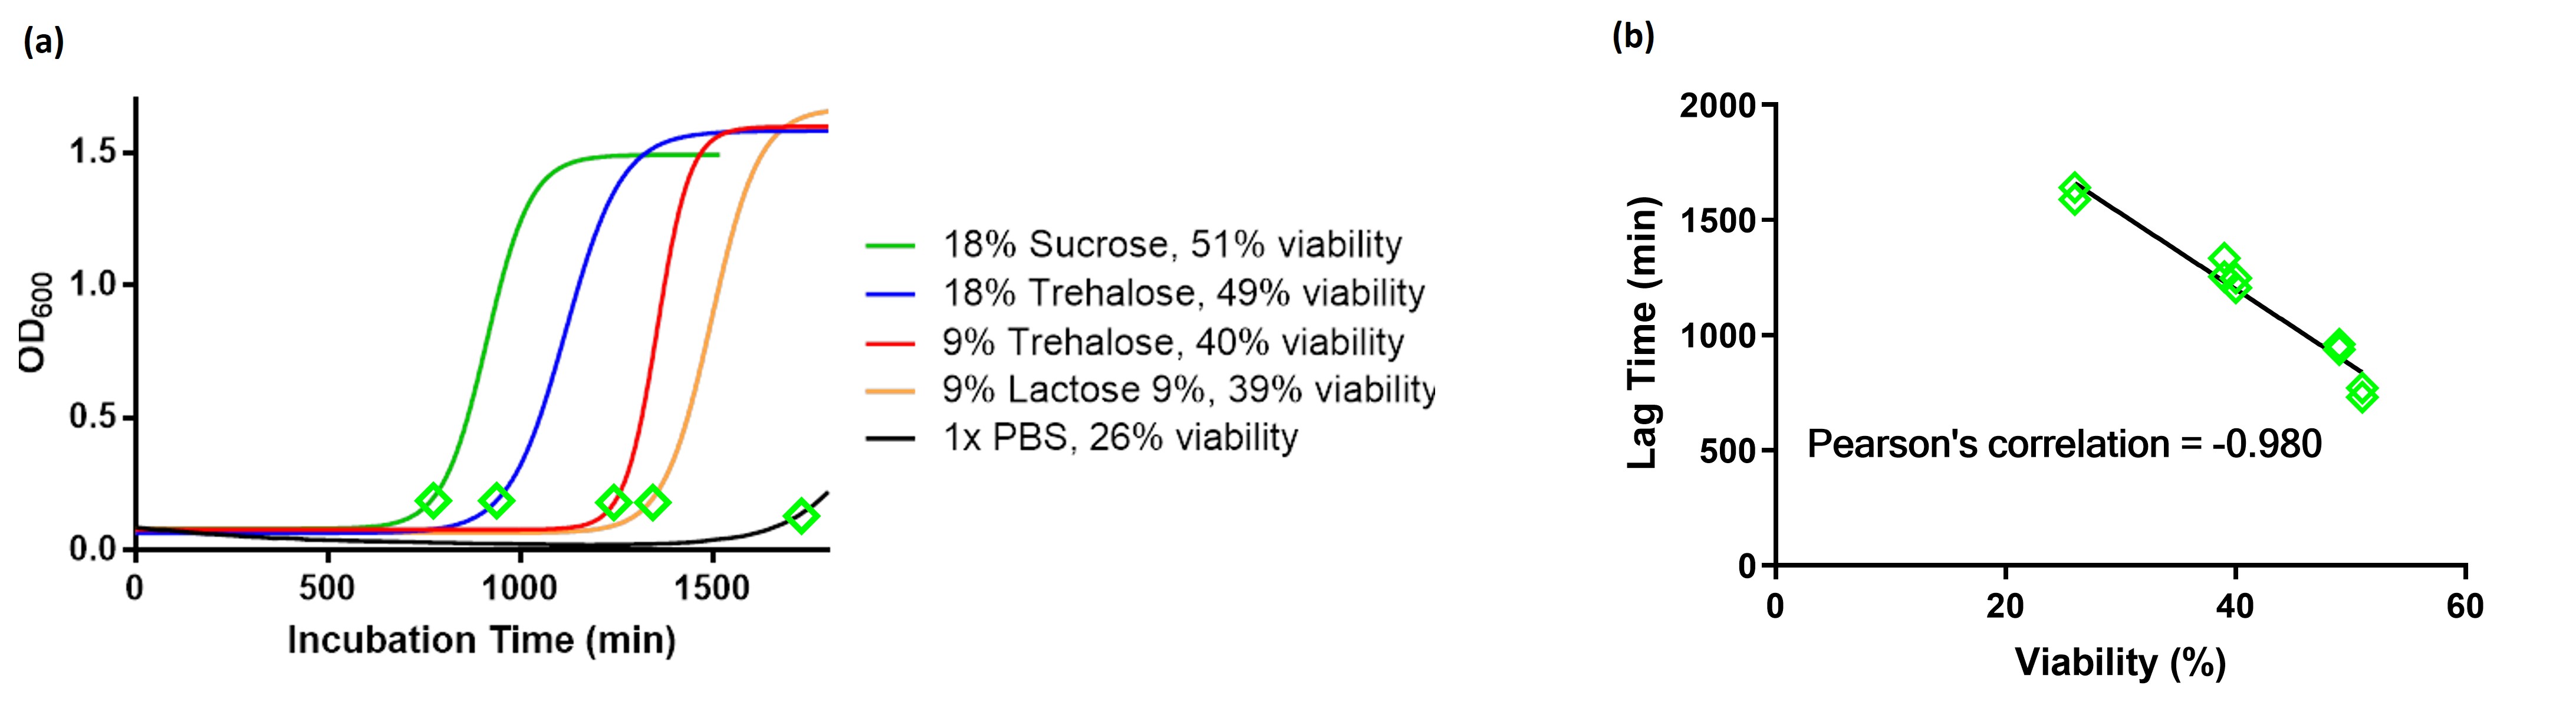 Figure 1. HTS method development. Lag time is the ranking parameter to evaluate different formulations. (a) High-viability lyophilized samples grew faster upon inoculation into YPD media. Lag time is labeled by green squares. (b) Linear regression shows lag time and viability are negatively associated.
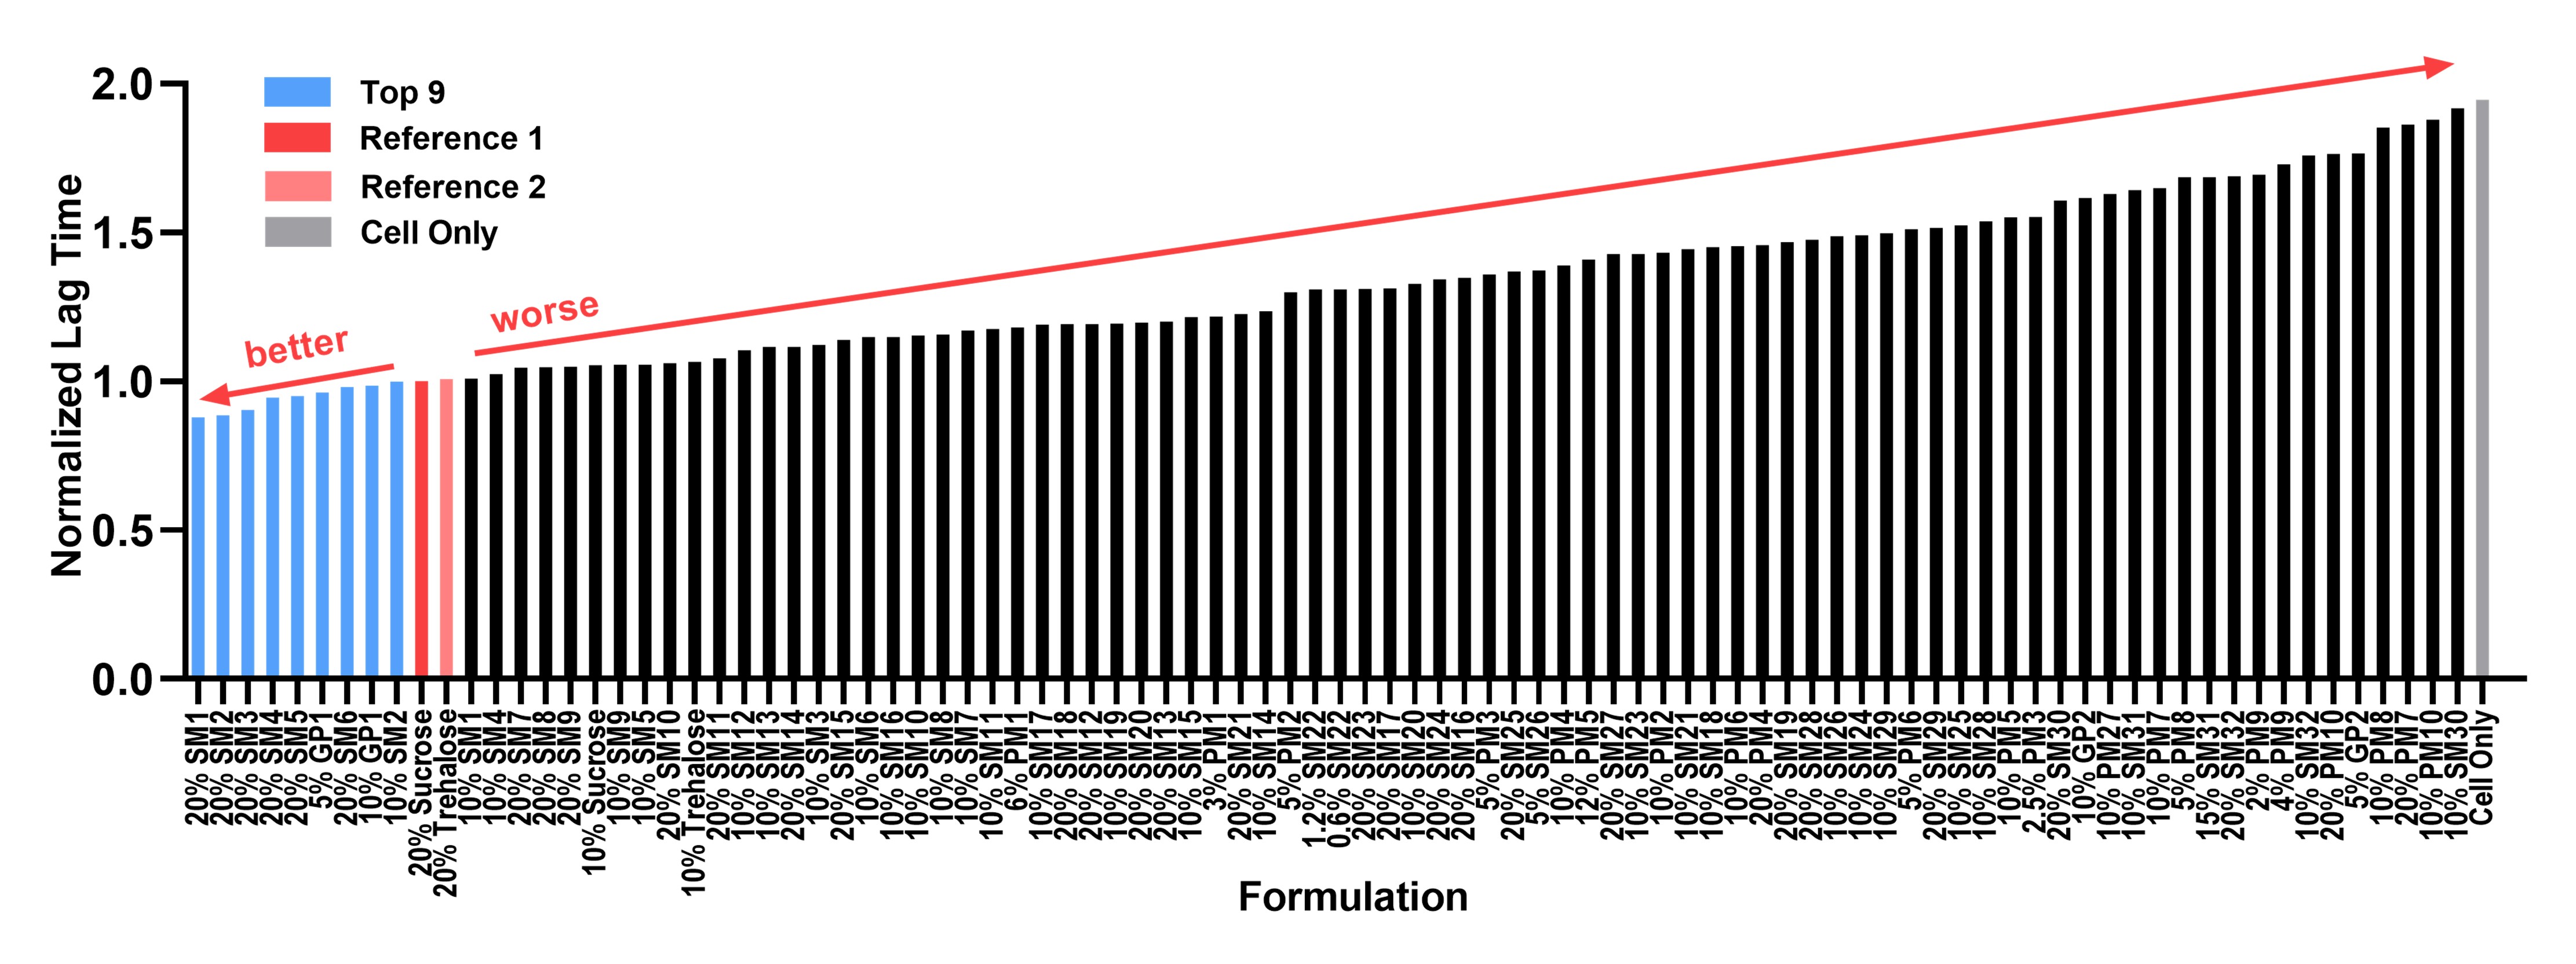 Figure 2. 94 formulations were screened and ranked by normalized lag time. All the screened formulations performed better than the negative control, consisting of Sb cell only (gray). 9 out of 94 performed better than the standard references (20% sucrose, red, and 20% trehalose, pink).
 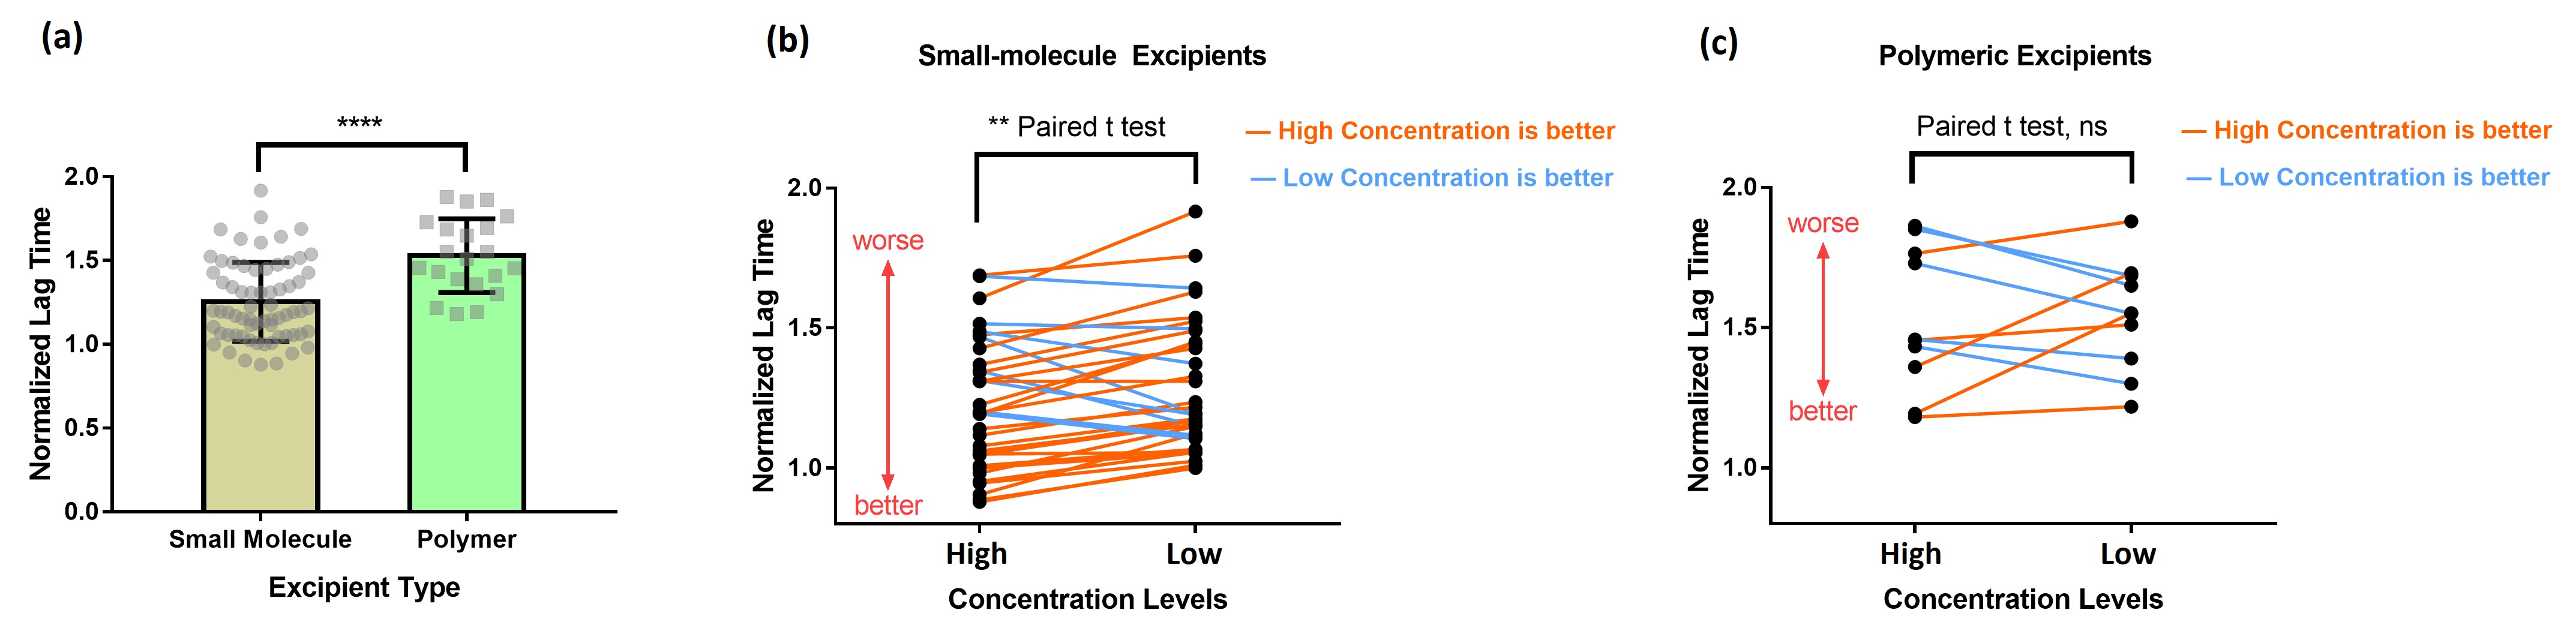 Figure 3. Investigations into attributes of a good formulation. (a) Small-molecule excipients result in significantly less lag time (b) The performance of each excipient under high and low concentrations are paired for comparison. Orange line indicates an excipient performed better at its high concentration level, while blue line indicates the opposite. Small-molecule excipients at higher concentrations demonstrate superior performance compared to those at lower concentrations per screening range. (c) No such trend is observed for polymers.