
Formulation and Delivery - Biomolecular
Category: Late Breaking Poster Abstract
Peixin Liu, Ph.D.
Fudan University
Shanghai, Shanghai, China (People's Republic)
Chen Jiang, Ph.D.
Fudan University
Shanghai, Shanghai, China (People's Republic)
Tao Sun, Ph.D.
Fudan University
Shanghai, Shanghai, China (People's Republic)
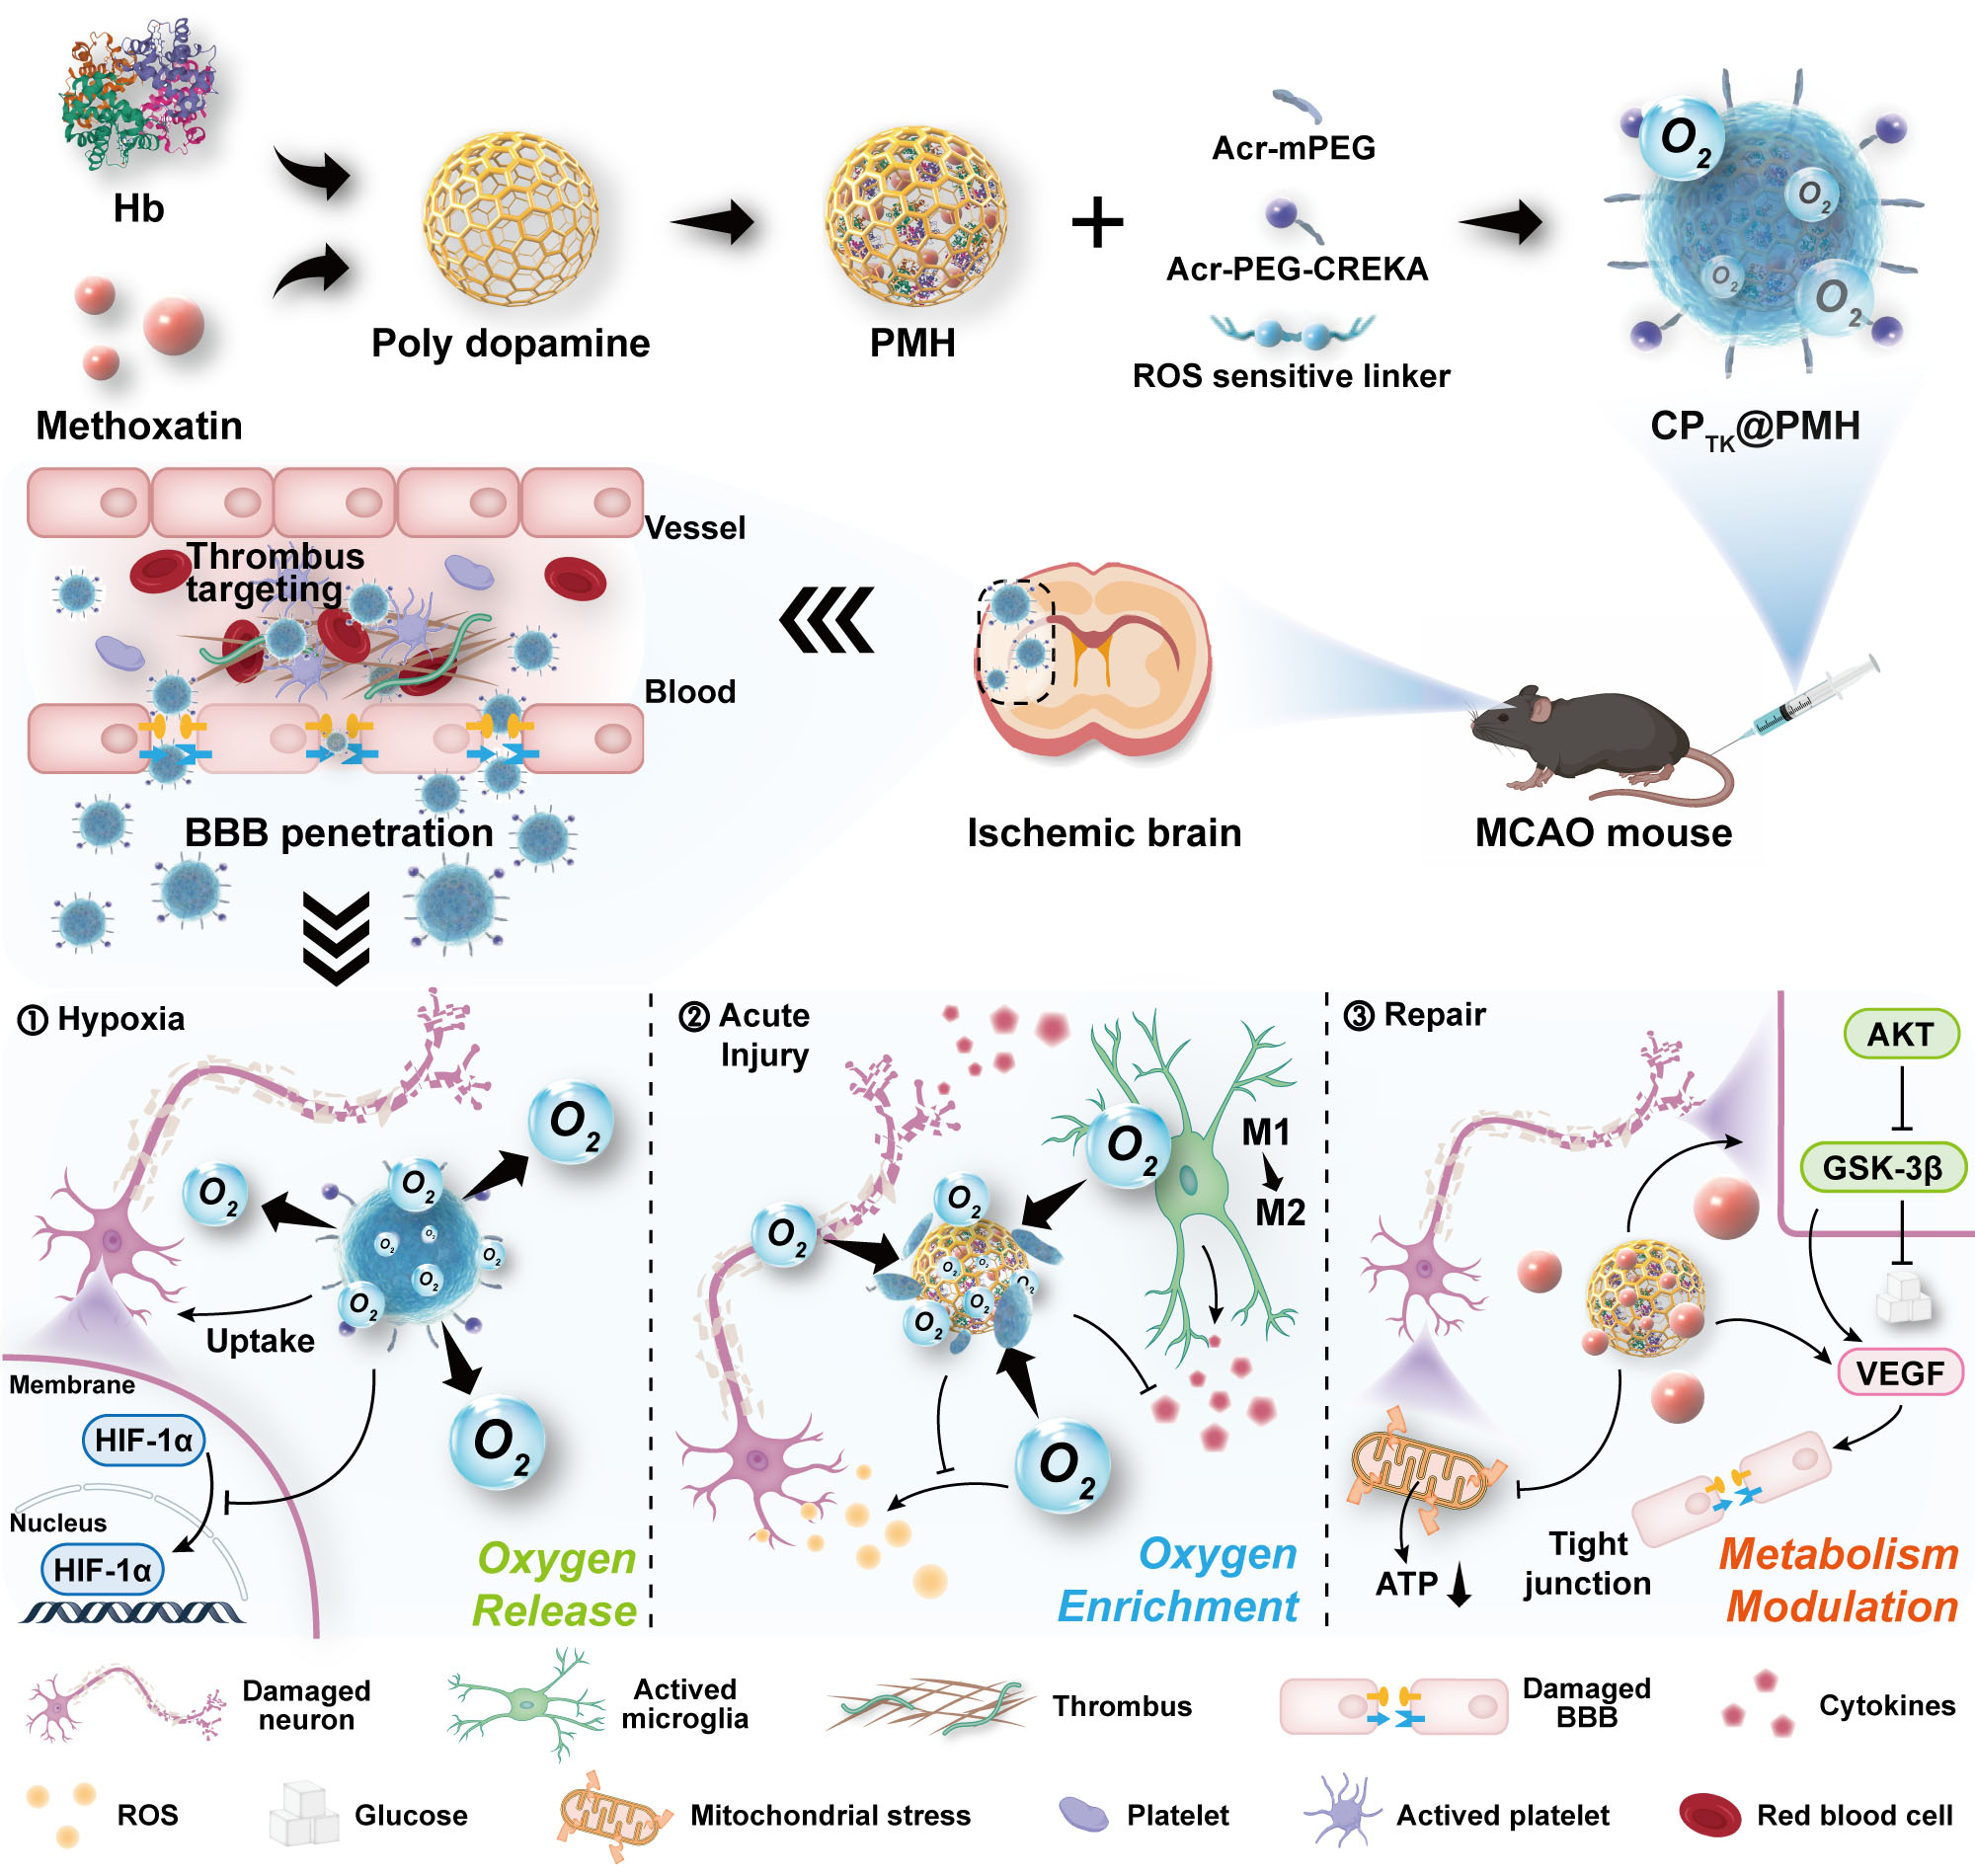 Figure 1. Illustration of the CPTK@PMH nanoerythrocyte formation and metabolic microenvironment modulation in ischemic brain: nanoerythrocyte accumulation in ischemic core via microthrombus binding and uptake by neurovascular unit after BBB penetration; (1) hypoxia-responsive oxygen release to relieve necroptosis; (2) oxygen balance regulation to alleviate acute reperfusion injury via oxygen enrichment, ROS scavenging and microglia polarization; (3) repair promotion achieved by metabolic microenvironment modulation via energy and glucose metabolism activation and BBB protection.
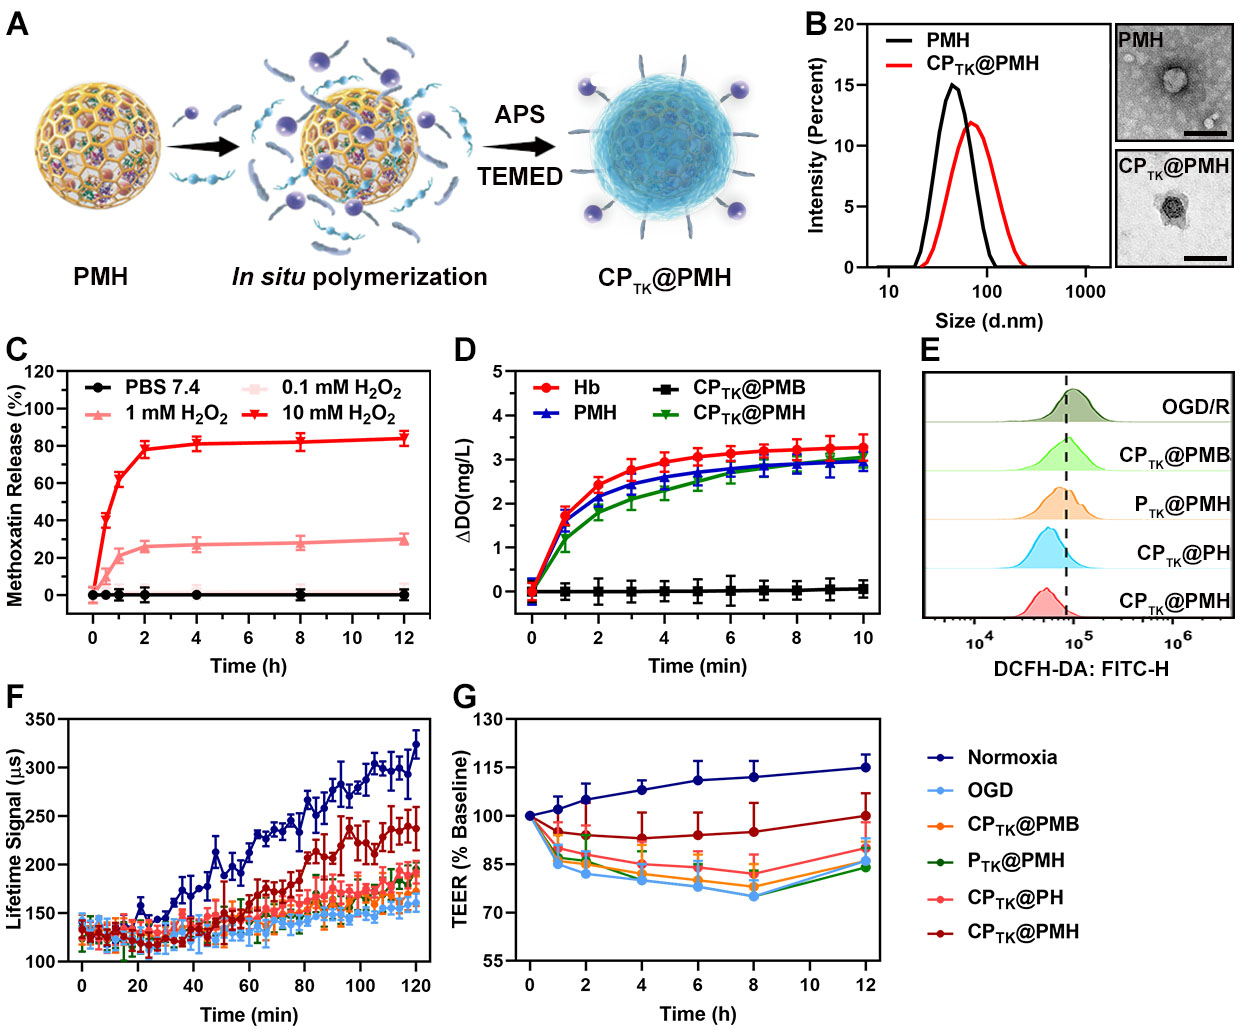 Figure 2. (A) Illustration of the in-situ polymerization triggered by APS/TEMED in the process of CPTK@PMH formation. (B) Size distribution and TEM images of PMH and CPTK@PMH (scale bar: 100 nm). (C) Methoxatin release profile of CPTK@PMH with or without incubation with different concentration of H2O2 in PBS 7.4 at 37 °C. (D) Monitoring of oxygenconcentration in PBS after adding oxygen pre-saturated Hb, CPTK@PMB, PMH, and CPTK@PMH with an equivalent content of 3 mg/mL Hb or BSA. (E) Flow cytometry analysis of ROS probe fluorescence intensity in OGD/R treated cells. (F) Lifetime profile of Oxygen Consumption Assay (OCR) for OGD treated cells. (G) Relative changes of transepithelial electrical resistance (TER) of bEnd.3 monolayer after 4 h OGD and different times of reoxygenation.
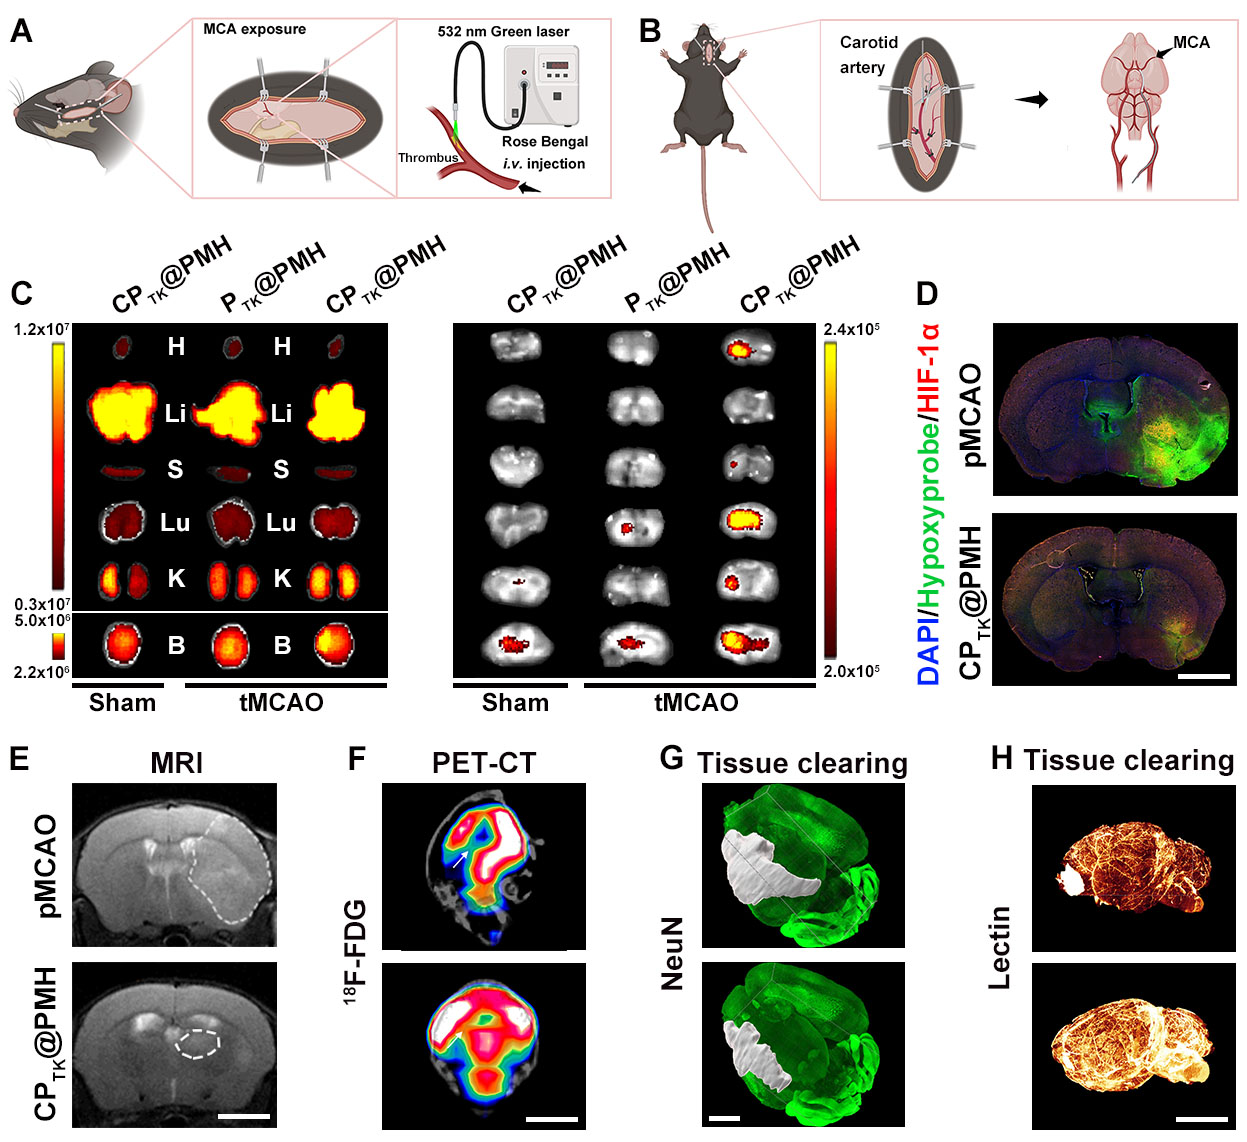 Figure 3. (A) Illustration of pMCAO mice model establishment. (B) Illustration of tMCAO mice model establishment. (B) Ex vivo IVIS images of major organs 6 h after intravenous injection and representative fluorescence images of brain slices excised after IVIS imaging. (D) Immunostaining of hypoxic markers (scale bar: 4 mm). (E) The infarct area of tMCAO mice treated with different formulations, monitored by MRI at 24 h post reperfusion (scale bar: 4 mm). (F) Representative [18F]FDG PET/CT images of tMCAO model mice brains (scale bar: 4 mm). (G) Whole-brain NeuN imaging with tissue clearing and tracing of lesion area (scale bar: 5 mm). (H) Tissue clearing results of vessel (Lectin staining) in tMCAO model mice whole brains (scale bar: 5 mm).