
Preclinical and Translational Sciences - Biomolecular
Category: Late Breaking Poster Abstract
.jpg "Tânia Martins Garcia, PhD (she/her/hers) photo")
Tânia Martins Garcia, PhD (she/her/hers)
Project Manager
TIM Company, The
Delft, Zuid-Holland, Netherlands
Tânia Martins Garcia, PhD (she/her/hers)
Project Manager
TIM Company, The
Delft, Zuid-Holland, Netherlands
Dyko Minekus, M.S.
TIM Company, The
Delft, Zuid-Holland, Netherlands
Richard Barker, B.S.
AstraZeneca
Macclesfield, England, United Kingdom
James Butler, Ph.D.
GlaxoSmithKline plc
London, England, United Kingdom
Inese Sarcevica, Ph.D.
Pfizer Inc.
Kent, England, United Kingdom
Kieran Smith, M.S.
Pfizer Inc.
Kent, England, United Kingdom
Malgorzata Strozyk, B.S.
GlaxoSmithKline plc
London, England, United Kingdom
Irena Tomaszewska, Ph.D.
Pfizer Inc.
Kent, England, United Kingdom
Tom Ooms, M.S.
Janssen
Beerse, Antwerpen, Belgium
Robert Schwabe, M.S.
Boehringer Ingelheim
Ridgefield, Connecticut, United States
Andrea Wahl, M.S.
AbbVie Inc.
Ludwigshafen, Rheinland-Pfalz, Germany
Alvaro Lopez Marmol, Ph.D.
AbbVie Inc.
Ludwigshafen, Rheinland-Pfalz, Germany
Susann Bellmann, M.S.
TIM Company, The
Delft, Zuid-Holland, Netherlands
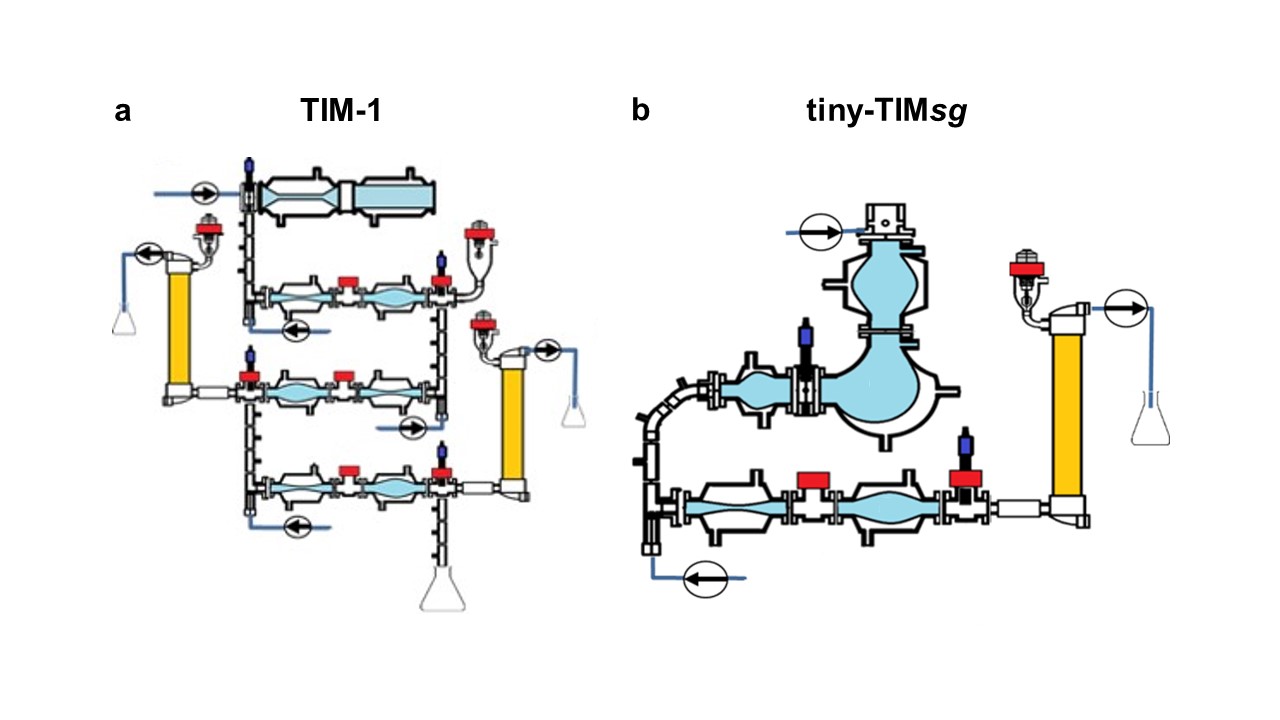 Fig. 1 – Schematic representation of the (A) TIM-1 system with conventional horizontal gastric compartment and three small intestinal compartments simulating the duodenum, jejunum, and ileum, and of the (B) tiny-TIMsg system with the advanced gastric compartment (TIMagc) and one small intestinal compartment. The filters that collect the bioaccessible paracetamol are indicated in yellow.
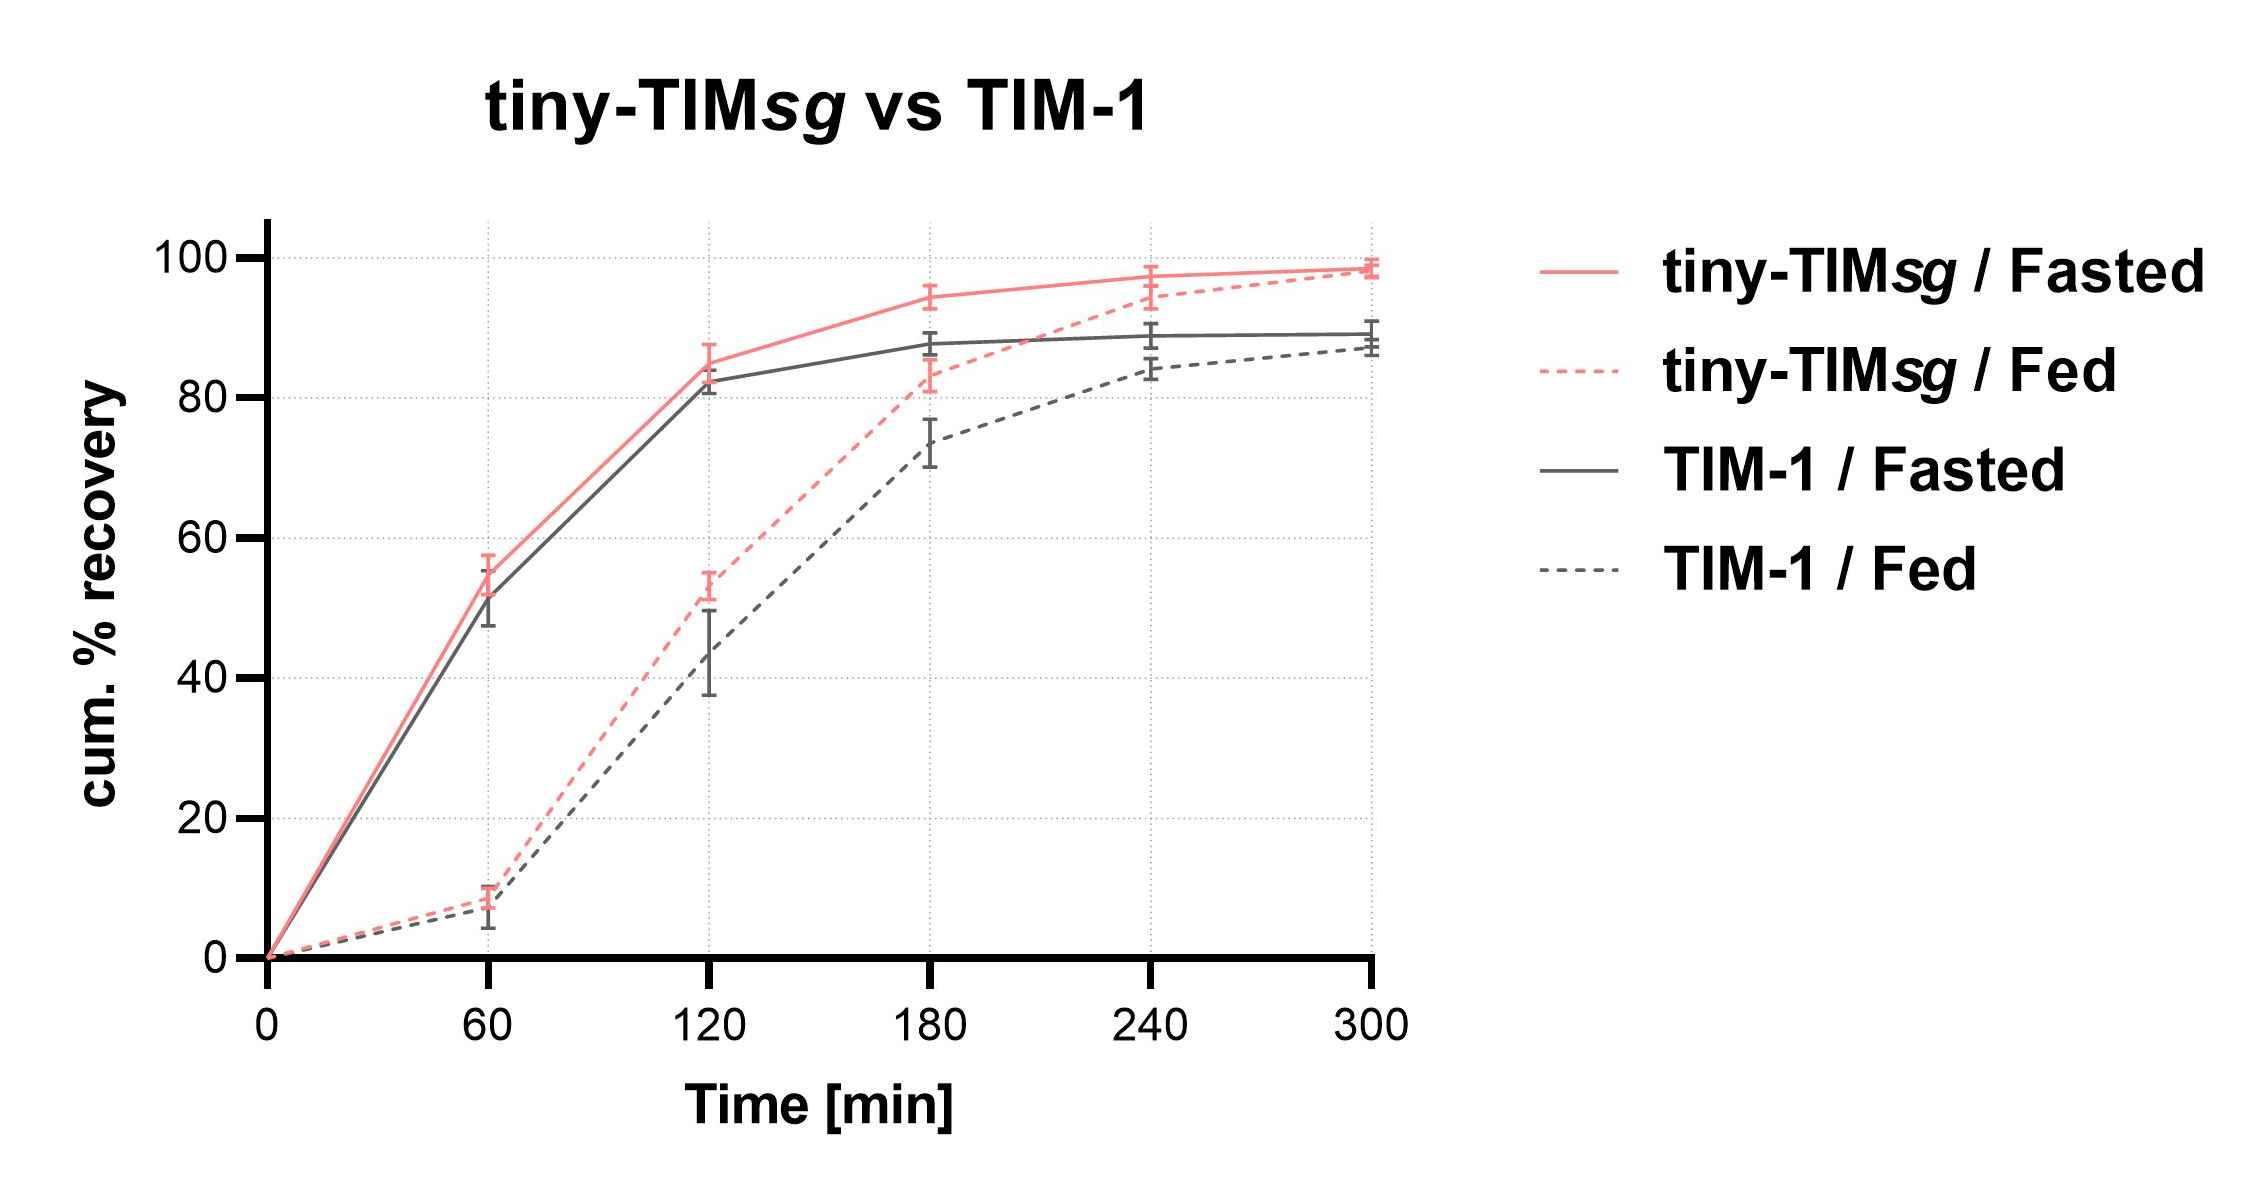 Fig. 2 – Cumulative total bioaccessibility of paracetamol (% recovey) per 60 min time intervals in the TIM-1 system (blue lines) and in the tiny-TIMsg (red lines) under fasted state (solid lines) and fed state conditions (dotted lines). Mean ± S.D (TIM-1: n=12 in 4 laboratories; tiny-TIMsg: n=13 in 5 laboratories and n=9 in 4 laboratories, for fasted state and fed state, respectively.)
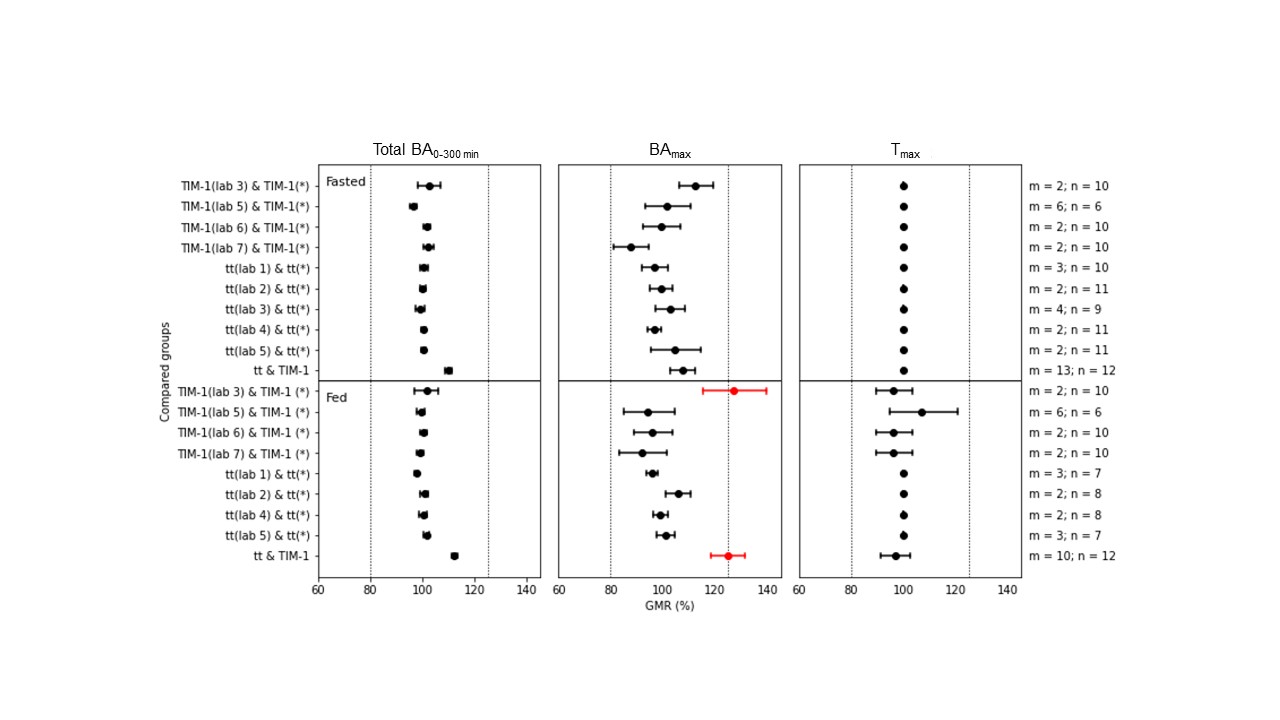 Fig. 3 – Equivalence comparison for Total BA0-300 min, BAmax, and Tmax in fasted state and fed state conditions. Each line indicates the comparison between one laboratory and the pool of the remaining laboratories with the same TIM system (*). The last line indicates the comparison between TIM-1 and tiny-TIMsg (tt). m indicates the number of replicates per laboratory; n indicates the number of replicates per laboratory pool; vertical lines enclose 80% and 125% confidence interval to conclude equivalence of compared groups; dots indicate the GMR and bars the confidence interval.