
Manufacturing and Analytical Characterization - Biomolecular
Category: Late Breaking Poster Abstract
Andrea Hawe, Ph.D.
Coriolis Pharma Reserach GmbH
Martinsried, Bayern, Germany
Brecht Vanbillemont, Ph.D.
Coriolis Pharma Research GmbH
Martinsried, Bayern, Germany
Andrea Arsiccio, Ph.D.
Coriolis Pharma Research GmbH
Martinsried, Bayern, Germany
Wolfgang Friess
Ludwig Maximilian University Munich
Munich, Bayern, Germany
Tim Menzen, Ph.D.
Coriolis Pharma Research GmbH
Matrinsried, Bayern, Germany
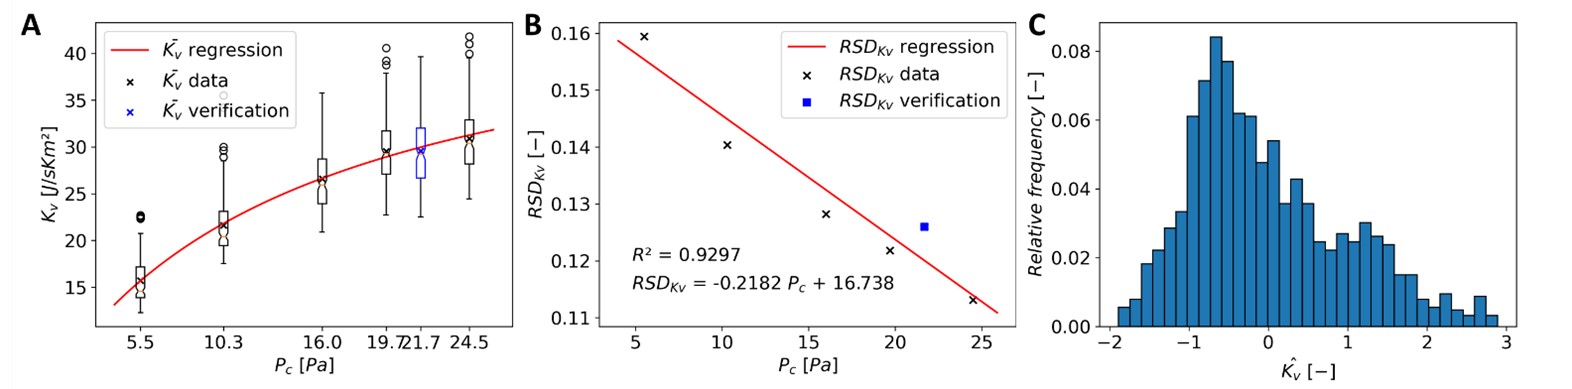 Figure 1: Graphical respresentation of the Kv experimental data and regressions for 6R glass type I vials. A: Experimental Kv distribution per pressure level is plotted as a boxplots with empty dots as outliers. The red line represents the weighted non-linear regression of the average. B: RSDkv at each pressure level is plotted with a marking. The red line represents the linear regression. C: Empirical distribution of normalized Kv data.
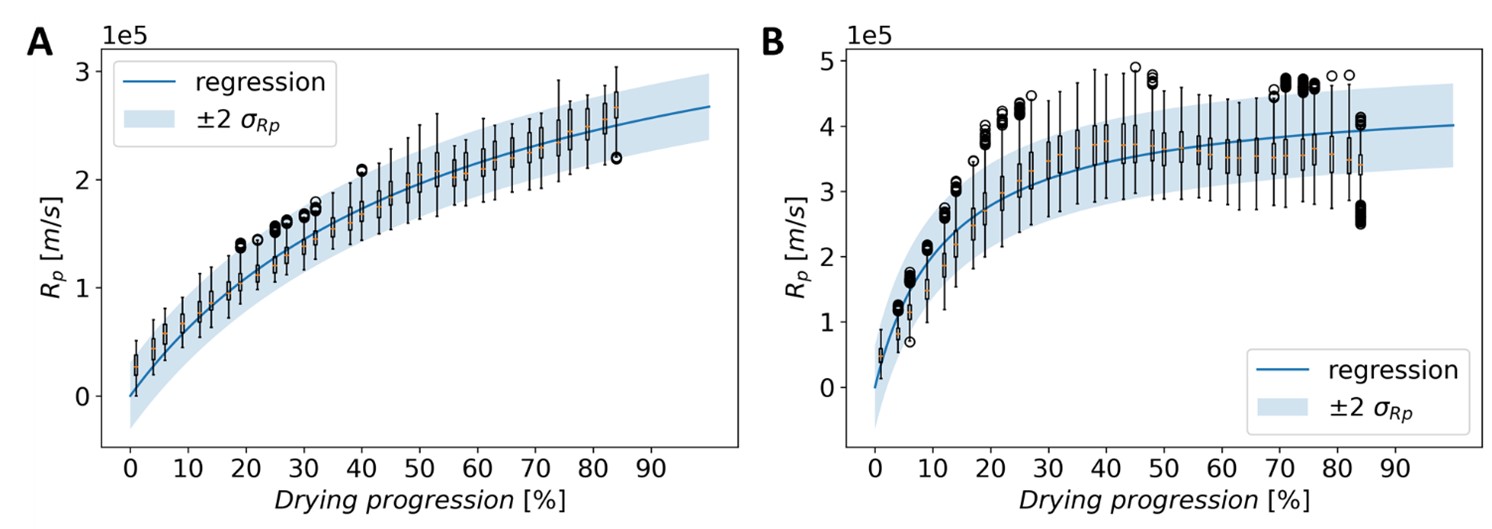 Figure 2: Graphical respresentation of the Rp extracted from conservative lyophilization cycles. Experimental data is represented in boxplots with empty dots as outliers, blue line plot represents the Rp regression which is enlarged by ±2 σRp using a blue shaded area. A: ‘high’ Tc formulation and B: ‘low’ Tc formulation.
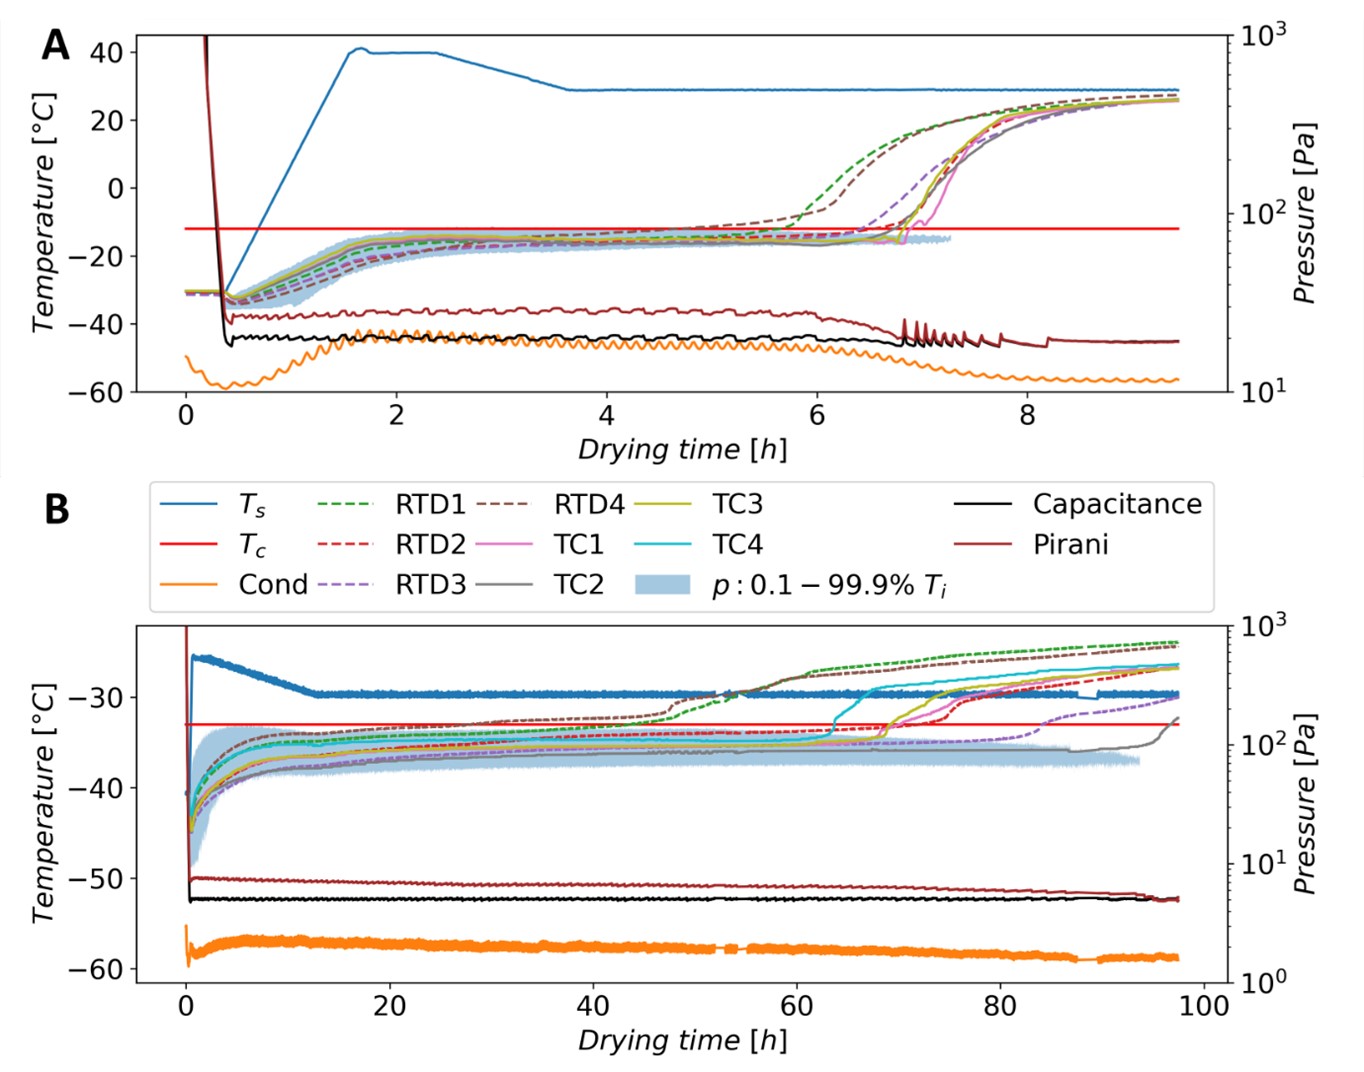 Figure 3: Graphical overview of the verification experiments with process data overlayed with the predictions (blue area) for the ‘high’ (A) and the ‘low’ (B) Tc formulation. Cond represents the condenser temperature.