
Formulation and Delivery - Chemical
Category: Late Breaking Poster Abstract
.jpg "Zahraa Al-Tamimi, MS photo")
Zahraa Al-Tamimi, MS
Graduate Research Assistant
University of Kansas
Lawrence, Kansas, United States
Zahraa Al-Tamimi, MS
Graduate Research Assistant
University of Kansas
Lawrence, Kansas, United States
Michael J. Hageman, Ph.D.
University of Kansas
Lawrence, Kansas, United States
.jpg) Figure 1. Cumulative permeated amount (Qt) versus time plot of octreotide in the receiver chamber when different donor conditions are used in the side-by-side diffusion cell. Flux can be calculated using the following equation: J= ΔQt / (A*Δt). Data are reported as mean ± standard deviation, n=3, *n=2. (R2> 0.998 in all cases)
Figure 1. Cumulative permeated amount (Qt) versus time plot of octreotide in the receiver chamber when different donor conditions are used in the side-by-side diffusion cell. Flux can be calculated using the following equation: J= ΔQt / (A*Δt). Data are reported as mean ± standard deviation, n=3, *n=2. (R2> 0.998 in all cases).jpg) Figure 2. Octreotide adsorption to different bile acid sequestrants as represented by octreotide concentration versus time plot. Data are reported as mean ± standard deviation, n=3.
Figure 2. Octreotide adsorption to different bile acid sequestrants as represented by octreotide concentration versus time plot. Data are reported as mean ± standard deviation, n=3.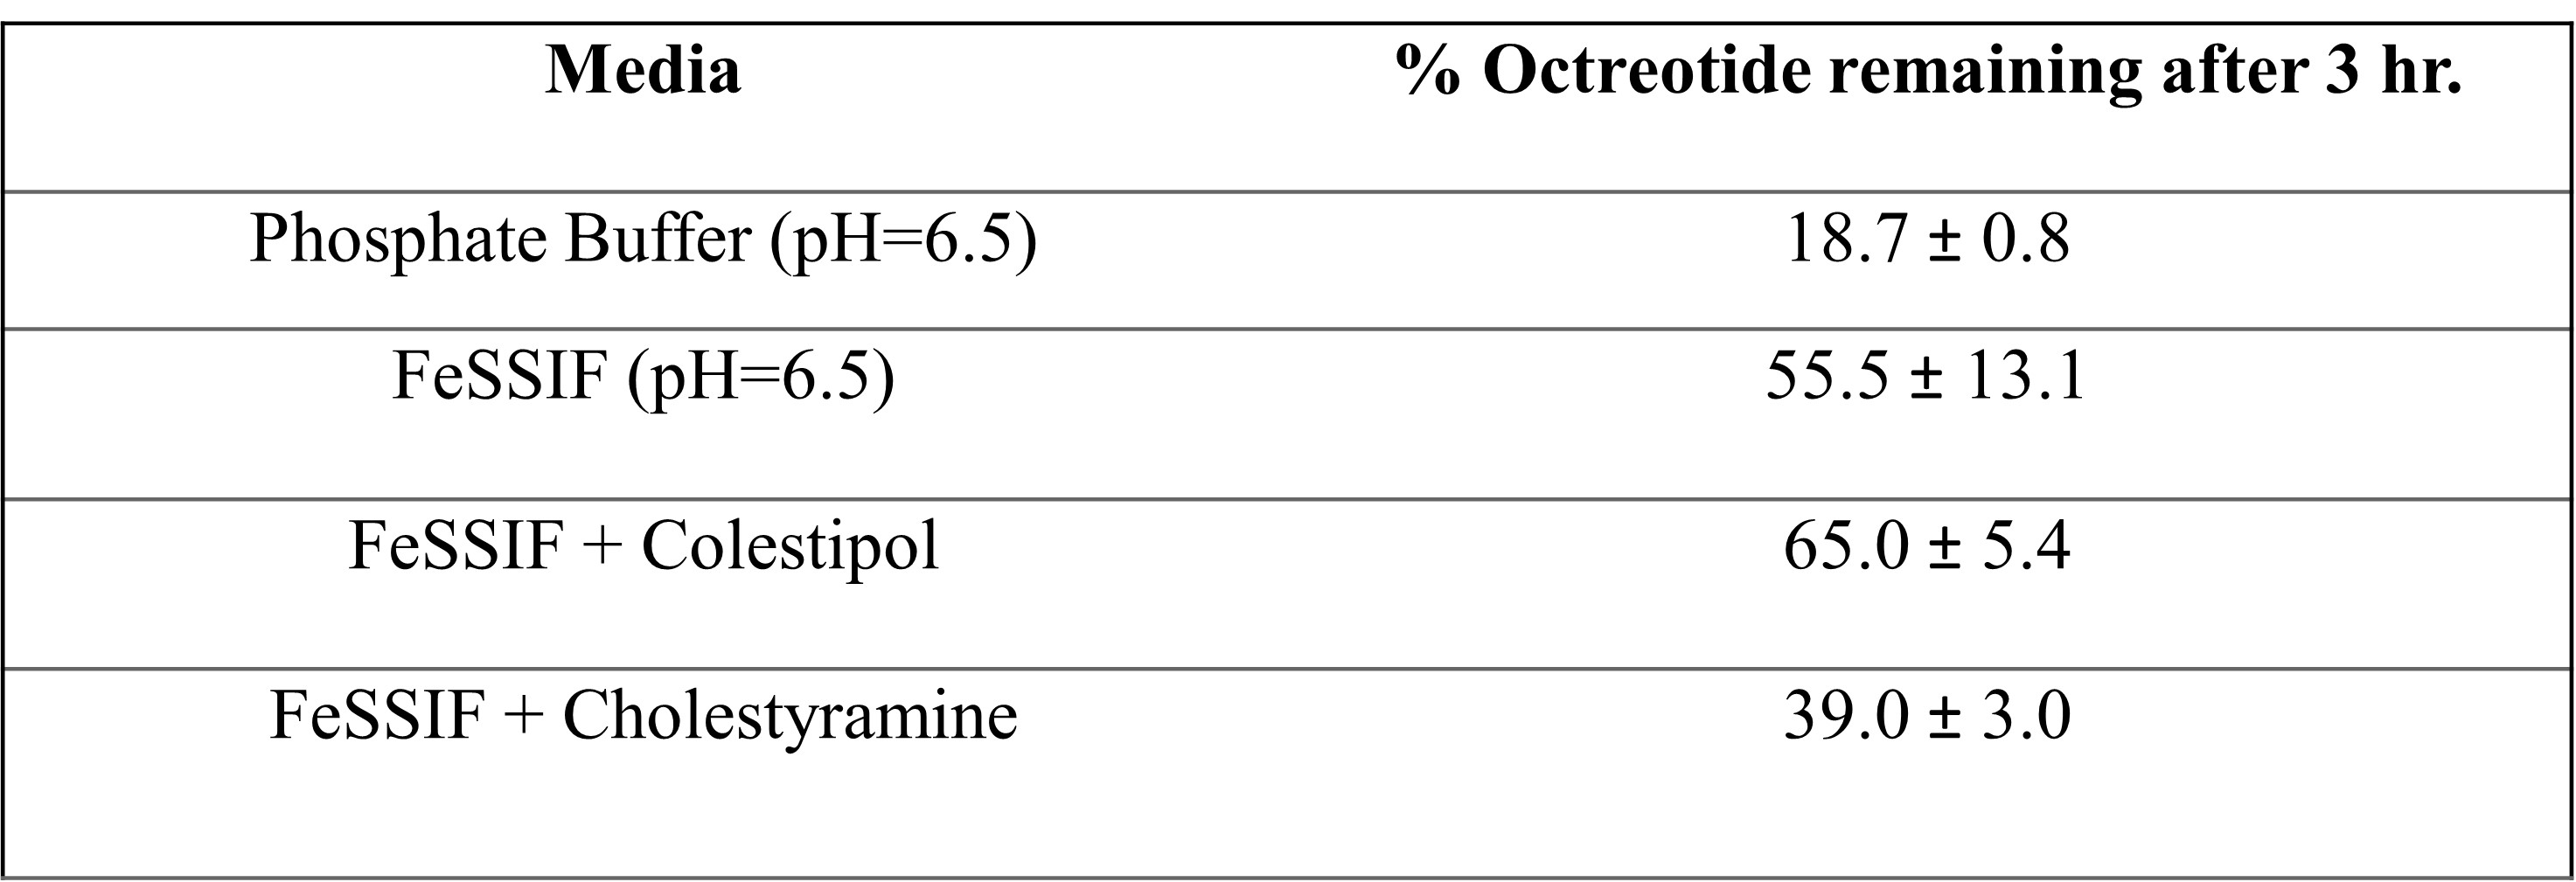 Table 1. Percentage of octreotide remaining after incubation for 3 hours with pancreatin in different media. Values are represented as mean ± standard deviation, n=3.