
Formulation and Delivery - Chemical
Category: Late Breaking Poster Abstract
 photo")
Kyle A. Frey, B.S. (he/him/his)
Formulation Scientist III
Quotient Sciences
Garnet Valley, Pennsylvania, United States
Kyle A. Frey, B.S. (he/him/his)
Formulation Scientist III
Quotient Sciences
Garnet Valley, Pennsylvania, United States
Helen Baker, Ph.D.
Quotient Sciences
Garnet Valley, Pennsylvania, United States
David A. Engers, Ph.D.
Quotient Sciences
Garnet Valley, Pennsylvania, United States
Dale Purcell, Ph.D.
Chemical Microscopy
West Lafayette, Indiana, United States
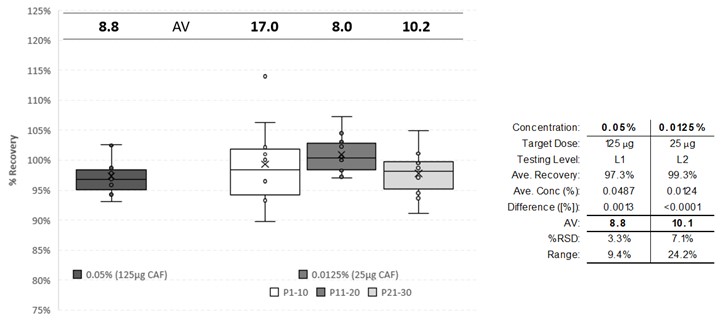 Fig. 1 BU results from 0.05% and 0.0125% blends of CAF/LA. All three sets of n=10 preparations from L2 testing of the 0.0125% are shown separately, with AV scores indicated above each blend. Averaged values from L1 and L2 results are reported in the table.
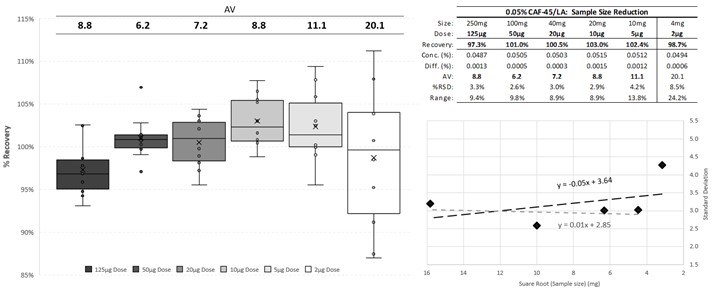 Fig. 2 Sample size effects on RAM performance for 0.05% CAF-45/LA blends.(Left) Raw results from BU testing of 250–4 mg sample sizes for target doses of 125–2 μg CAF, with corresponding AV scores. Note that even at the 2 μg level, all n=60 total preparations were within the limits of the abscissa marking ±15% label claim potency. and ±10% excluding this set.(Right Top) Summary findings from BU data. (Right Bottom) Scale of micromixing in BU samples. A slope of 0.05 was found from the n=5 data points shown (250–10 mg), while a slope of 0.01 could be determined from the range of 250–20 mg sample masses.
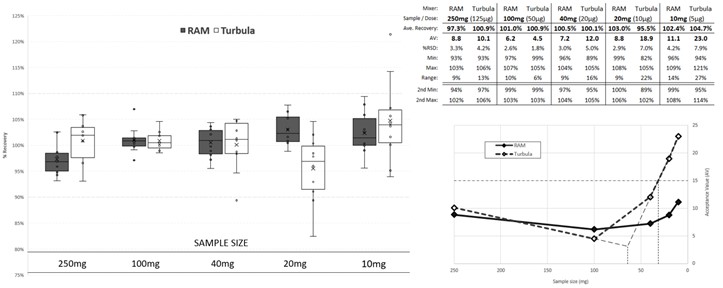 Fig. 3 Limits in mixing performance for RAM and Turbula. (Left & Right Top) Summary findings of side-by-side analysis of identical binary mixtures of 0.05% CAF/LA. (Right Bottom) Trending AV scores for both mixers, with Turbula data extrapolated for failure analysis showing sample masses marking projected AV failure and beginning of performance deterioration.