
Manufacturing and Analytical Characterization - Chemical
Category: Late Breaking Poster Abstract
 photo")
Jingyao Gan, M.S. (she/her/hers)
postdoc
University of Michigan
Ann Arbor, Michigan, United States
Jingyao Gan, M.S. (she/her/hers)
postdoc
University of Michigan
Ann Arbor, Michigan, United States
Jing Liang, Ph.D.
University of Michigan
ANN ARBOR, Michigan, United States
Vivian Juang, Ph.D.
University of Michigan
ANN ARBOR, Michigan, United States
 photo")
Anna Schwendeman, PhD (she/her/hers)
Hans W. Vahlteich Professor of Pharmacy
University of Michigan
Ann Arbor, Michigan, United States
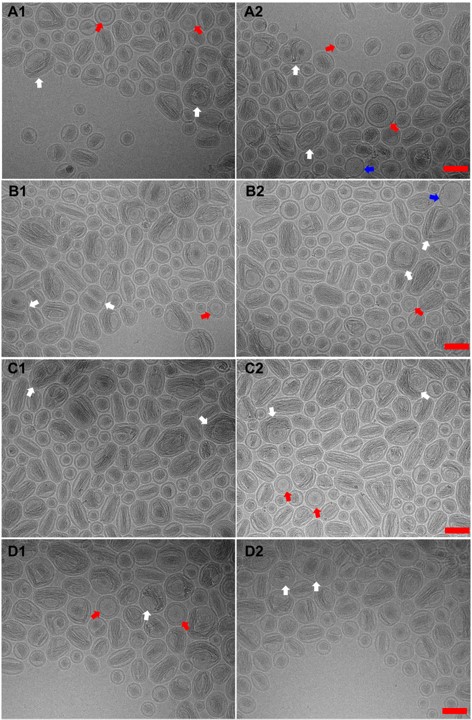 Figure 1. CryoTEM images of different batches of Onivyde. White arrows refer to multivesicular vehicles. Red arrows indicate multilamellar vehicles. Blue arrows point out unilamellar vehicles with little drug crystal inside. A1-A2, B1-B2, C1-C2 and D1-D2 are representative cryoTEM images of 1st batch, 2nd batch, 3rd batch, 4th batch of Onivyde respectively. Scale bat, 100 nm.
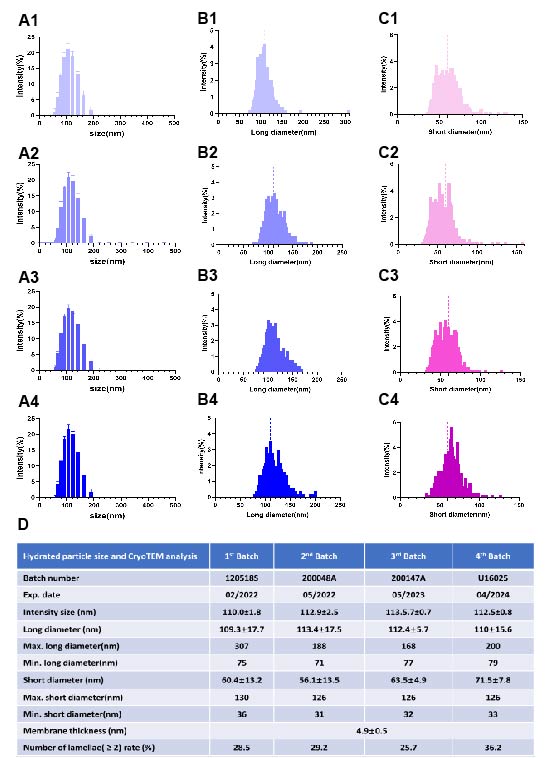 Figure 2. Hydrated particle size distribution and cryoTEM analysis of 4 batches of liposomal Onivyde formulations. A1-A4, intensity size distribution of 1st to 4th batch of Onivyde respectively. B1-B4, long diameter distribution of 1st to 4th batch of Onivyde respectively (n>500). C1-C4, short diameter distribution of 1st to 4th batch of Onivyde respectively (n>500). D, hydrated particle size and cryoTEM analysis. The number of observed and analyzed particles is over 500. All values are presented as mean ± SD(n≥3).
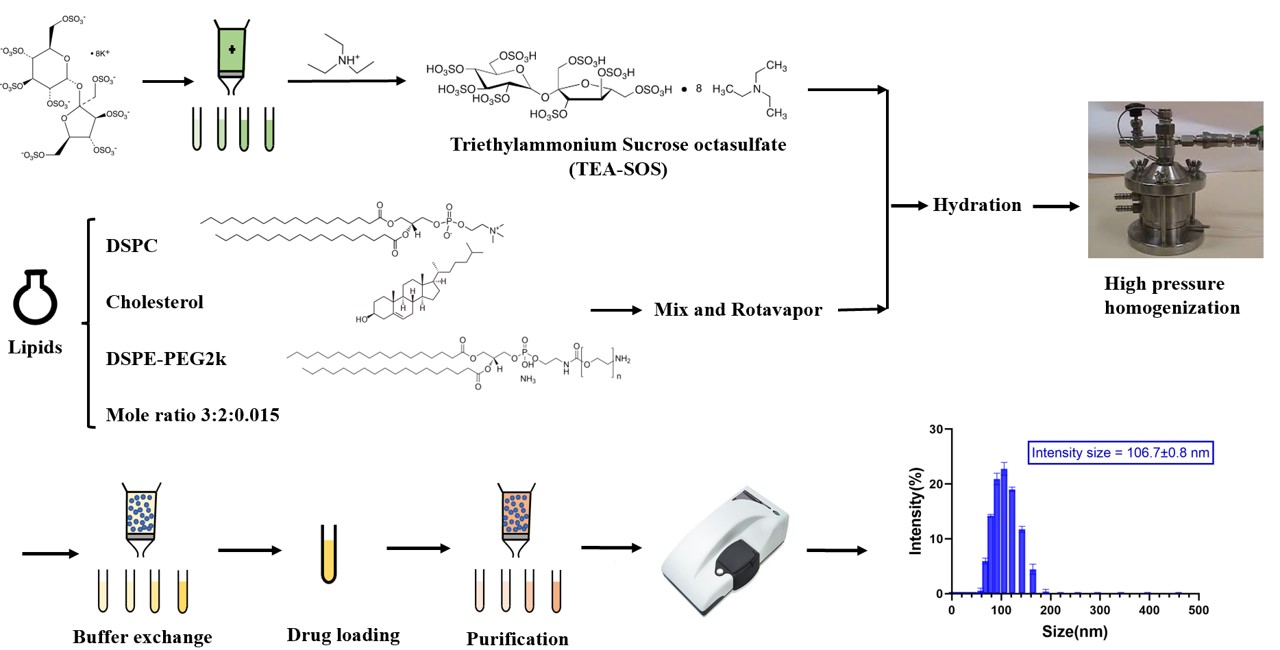 Figure 3. Manufacturing of Onivyde and the particle size and size distribution of first trial.