
Manufacturing and Analytical Characterization - Biomolecular
Category: Poster Abstract

Katharina Dauer, M.Sc.
Doctoral student
University of Bonn
Bonn, Nordrhein-Westfalen, Germany
Katharina Dauer, M.Sc.
Doctoral student
University of Bonn
Bonn, Nordrhein-Westfalen, Germany
Felix Ellwanger, M.Sc.
Karlsruhe Institute of Technology
Karlsruhe, Baden-Wurttemberg, Germany
Karl G. G. Wagner, Ph.D.
University of Bonn
Bonn, Nordrhein-Westfalen, Germany
Heike P. Karbstein, Ph.D.
Karlsruhe Institute of Technology
Karlsruhe, Baden-Wurttemberg, Germany
M. Azad Emin, Ph.D.
Nexnoa GmbH
Karlsruhe, Baden-Wurttemberg, Germany
.jpg) Color plots of the shear rate distribution of A ram extruder die B twin-screw extruder die; Color plots of the shear rate distribution of C TSE conveying elements (5 mm pitch) die D TSE 90° kneading elements.
Color plots of the shear rate distribution of A ram extruder die B twin-screw extruder die; Color plots of the shear rate distribution of C TSE conveying elements (5 mm pitch) die D TSE 90° kneading elements.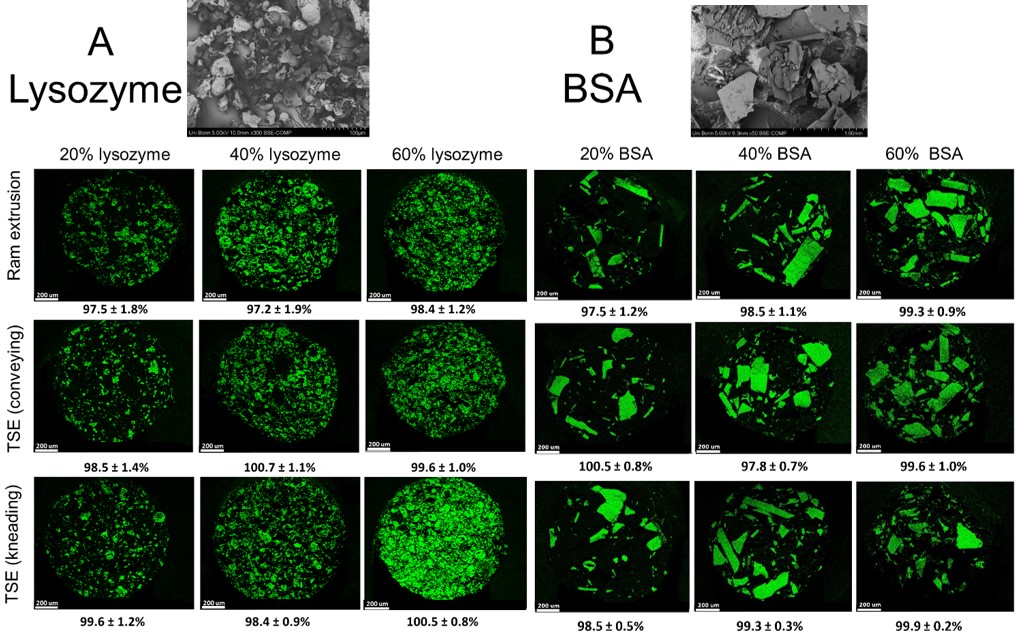 SEM-images of the used protein powder; protein particle distribution by SEM-EDX and elemental mapping of nitrogen (green spots) on cross-section of 20, 40, and 60% protein-loaded extrudates (A lysozyme and B BSA) prepared by ram or twin-screw extrusion (screw speed: 150 rpm) at 63°C and protein recovery rates determined by RP-HPLC (n = 3) below the SEM-EDX-images. The scale bar of SEM-images corresponds to 200 μm.
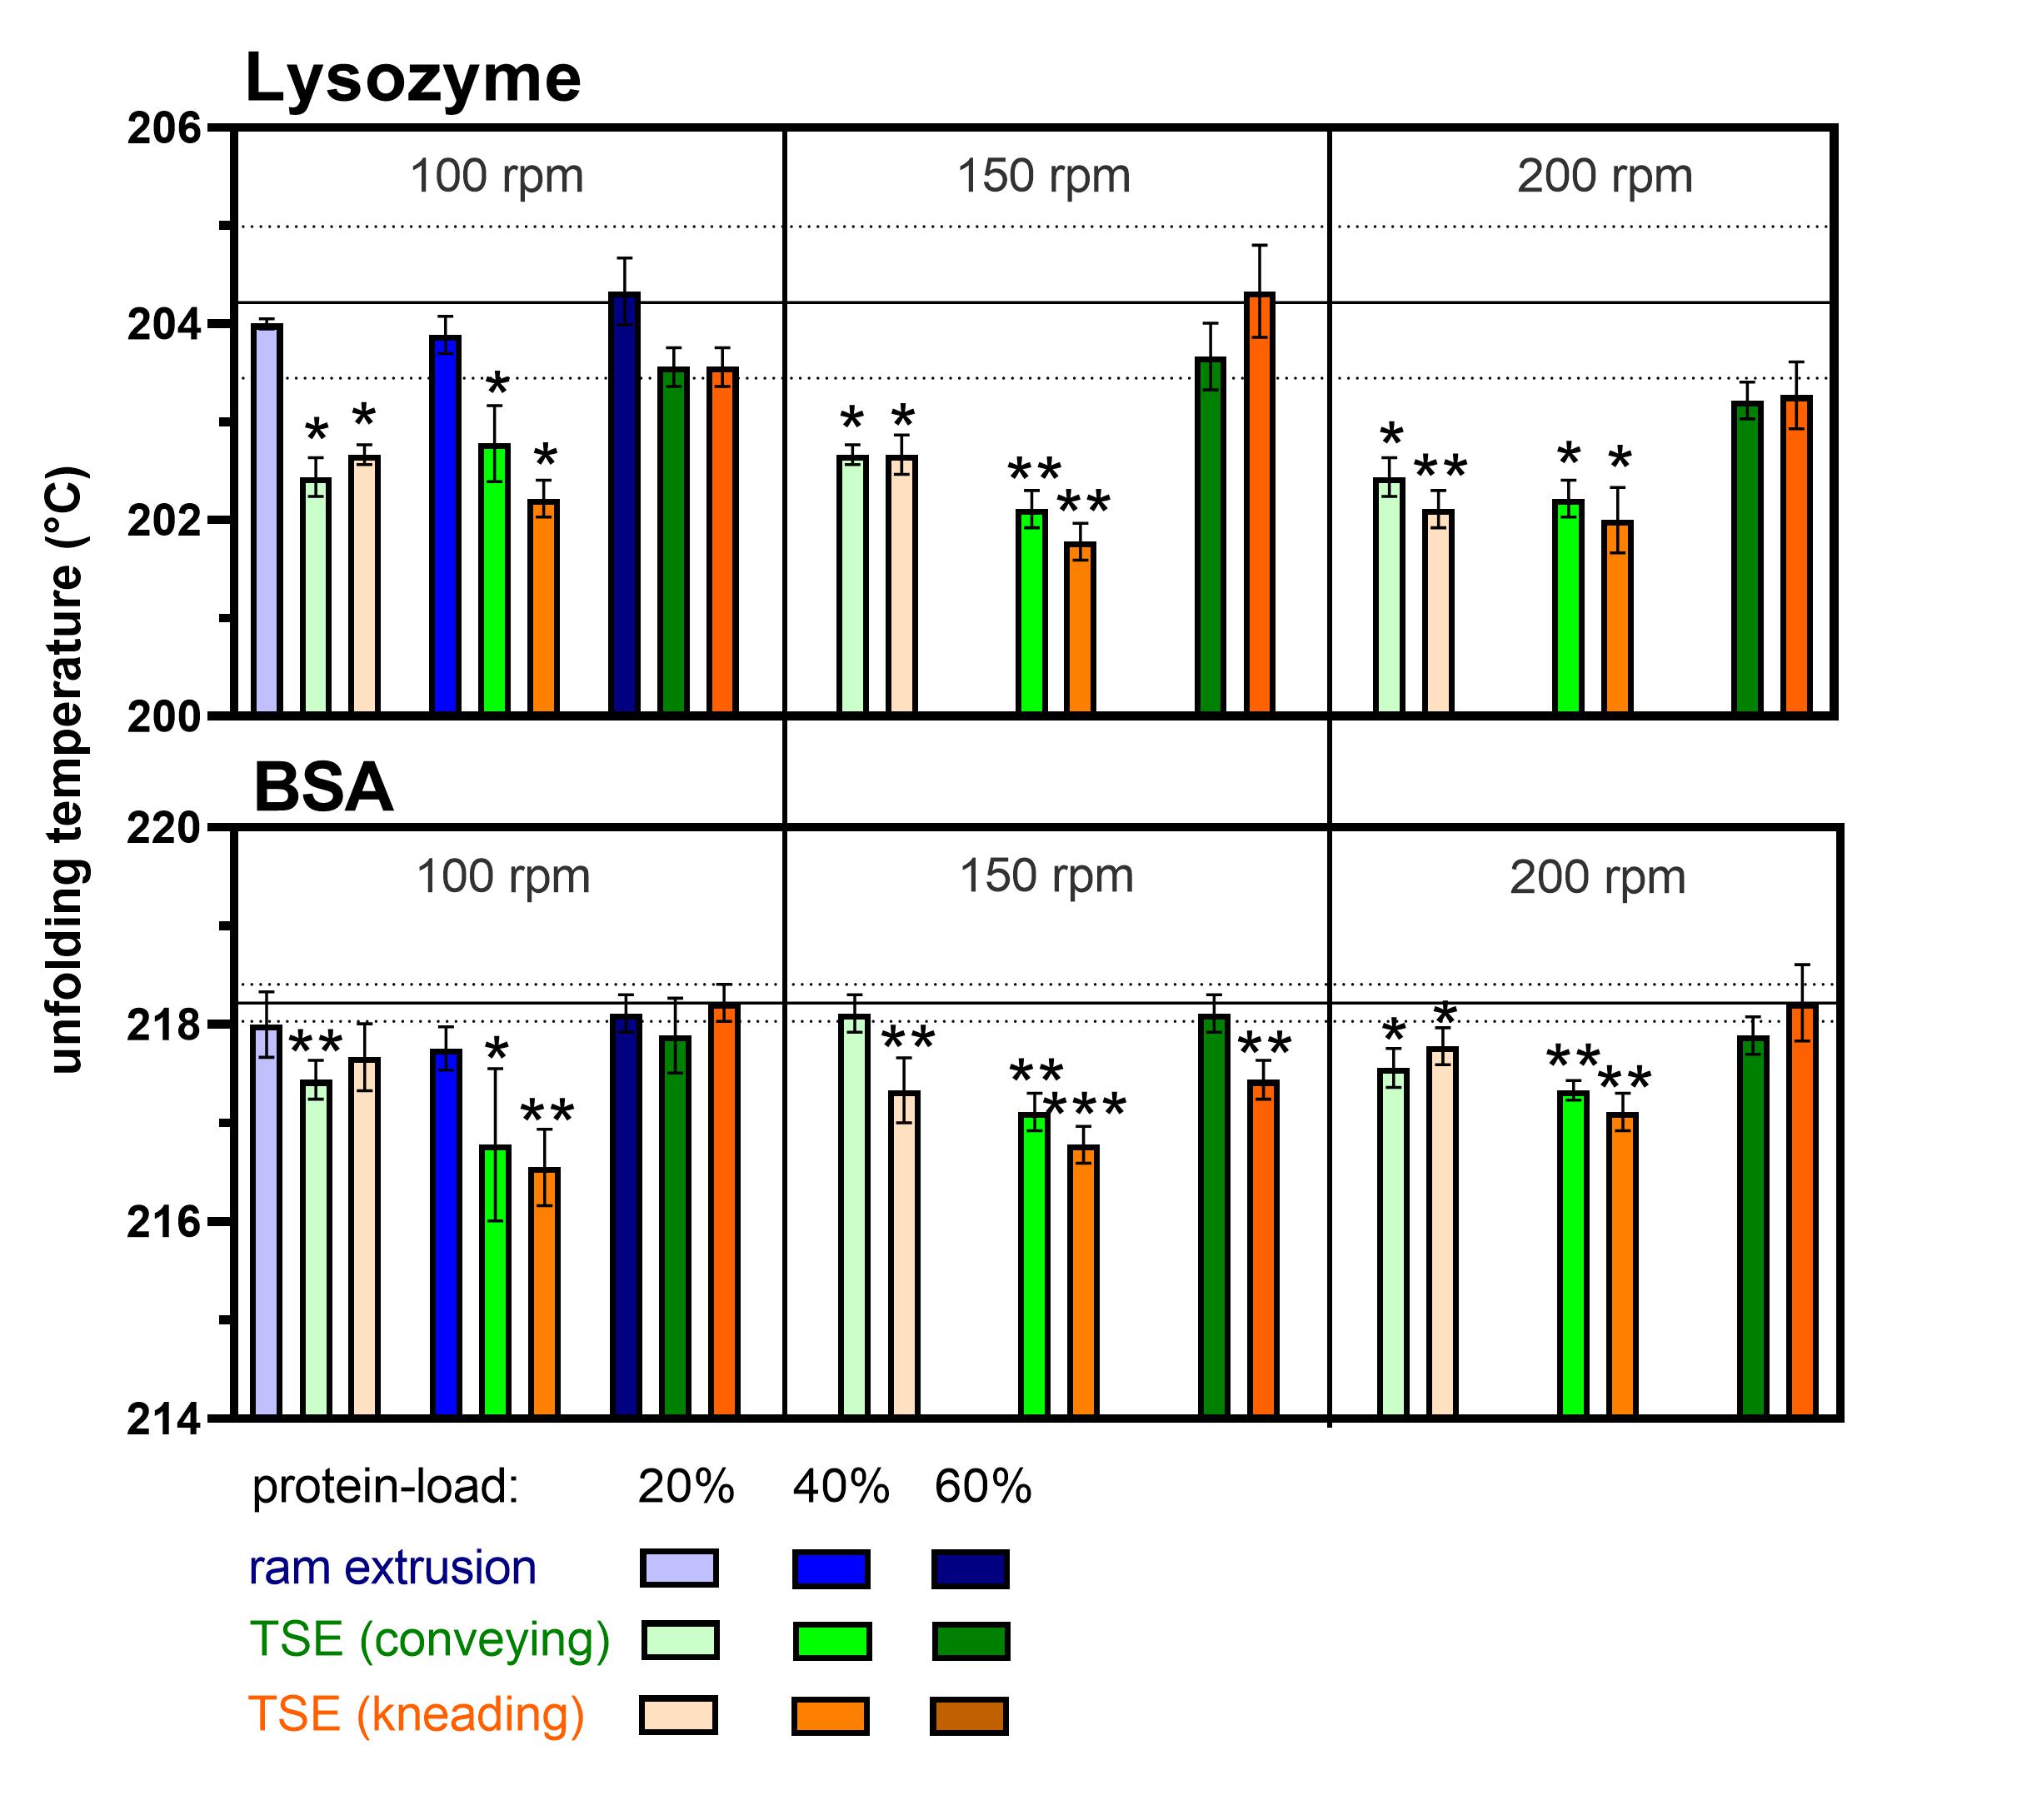 Unfolding temperatures of 20, 40, and 60% protein-loaded (lysozyme and BSA) extrudates prepared by ram extrusion (blue) or TSE with only conveying screw configuration (green), or screws containing a single 90° kneading element (orange) at 100, 150, or 200 rpm screw speed, at 63°C; error bars represent the standard deviation of three measurements for the unfolding temperature by DSC; the line shows the melting temperature of the unprocessed protein (reference) and the dotted lines represent the standard deviation (n = 3); statistical significance is compared to the reference and depicted by asterisks (*): * p < 0.05, ** p < 0.01, *** p < 0.001.