
Manufacturing and Analytical Characterization - Chemical
Category: Poster Abstract
.jpg "Naoki Yoshihara, BS photo")
Naoki Yoshihara, BS
Scientist
Sawai Pharmaceutical Co., Ltd.
Osaka, Osaka, Japan
Naoki Yoshihara, BS
Scientist
Sawai Pharmaceutical Co., Ltd.
Osaka, Osaka, Japan
Ryota Kimata, MS
Sawai Pharmaceutical Co., Ltd.
Osaka, Osaka, Japan
Takayuki Terukina, Ph.D.
University of Shizuoka
Shizuoka, Shizuoka, Japan
Takanori Kanazawa, Ph.D.
University of Shizuoka
Shizuoka, Shizuoka, Japan
Hiromu Kondo, Ph.D.
University of Shizuoka
Shizuoka, Shizuoka, Japan
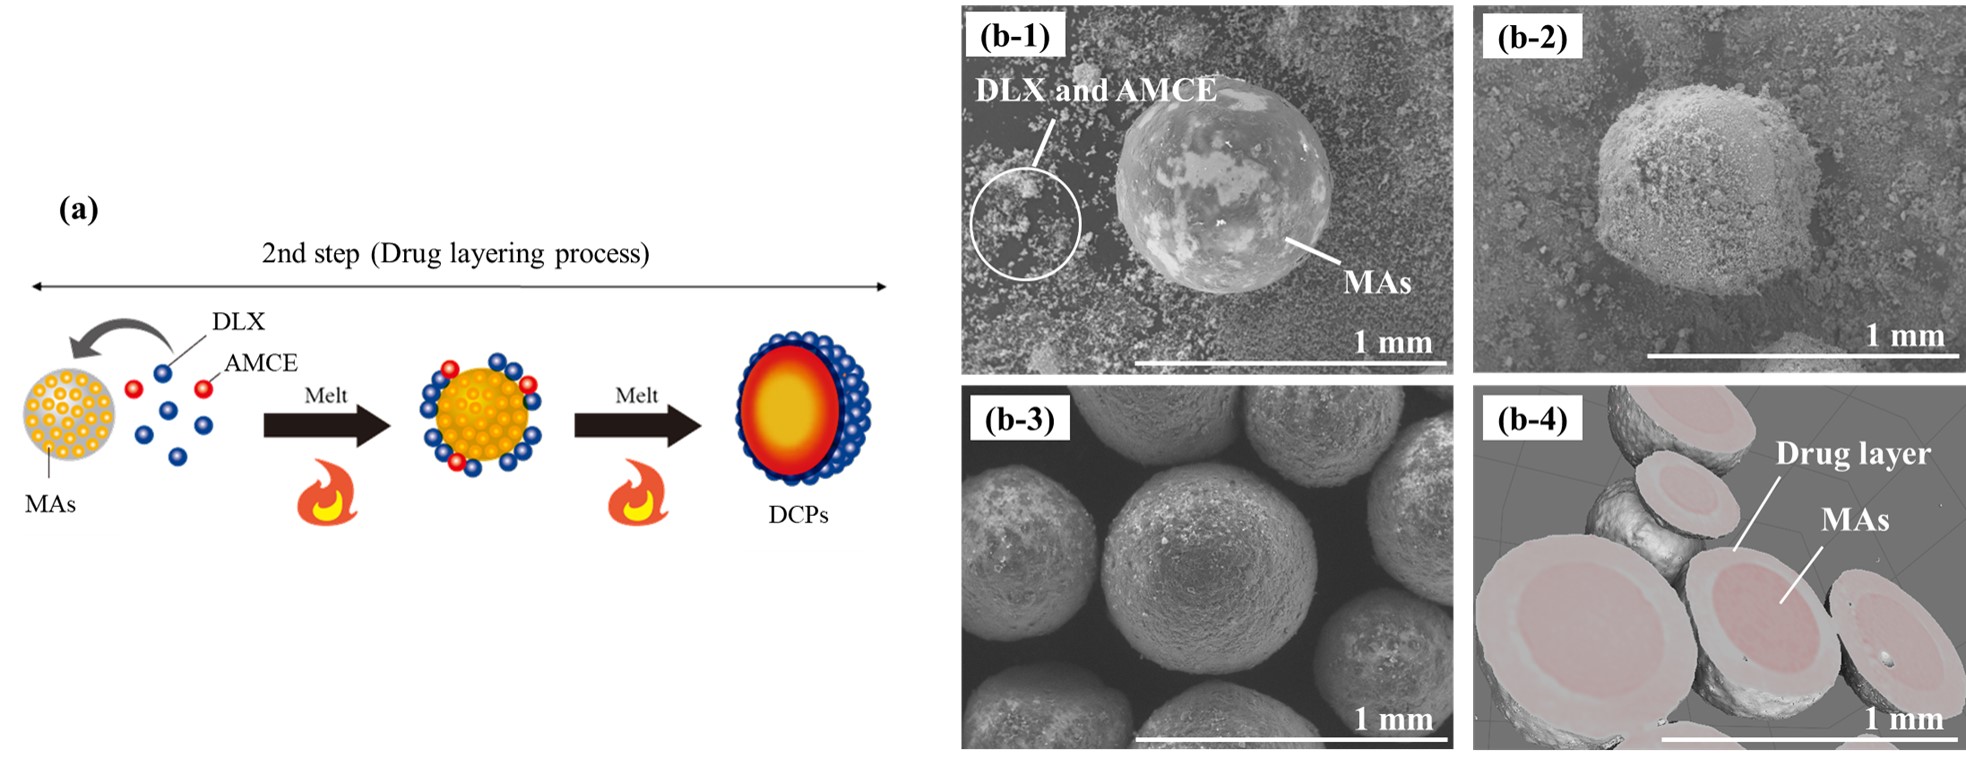 Figure 1. The image of temporal change and internal structure of DCPs in the 2nd step. (a) Schematic diagram, (b-1) initial, (b-2) process time 15min, (b-3) process time 28min, (b-4) internal structure of process time 28min
.jpg) Figure 2. Particle size distribution of HSD, MAs, and DCPs.
Figure 2. Particle size distribution of HSD, MAs, and DCPs.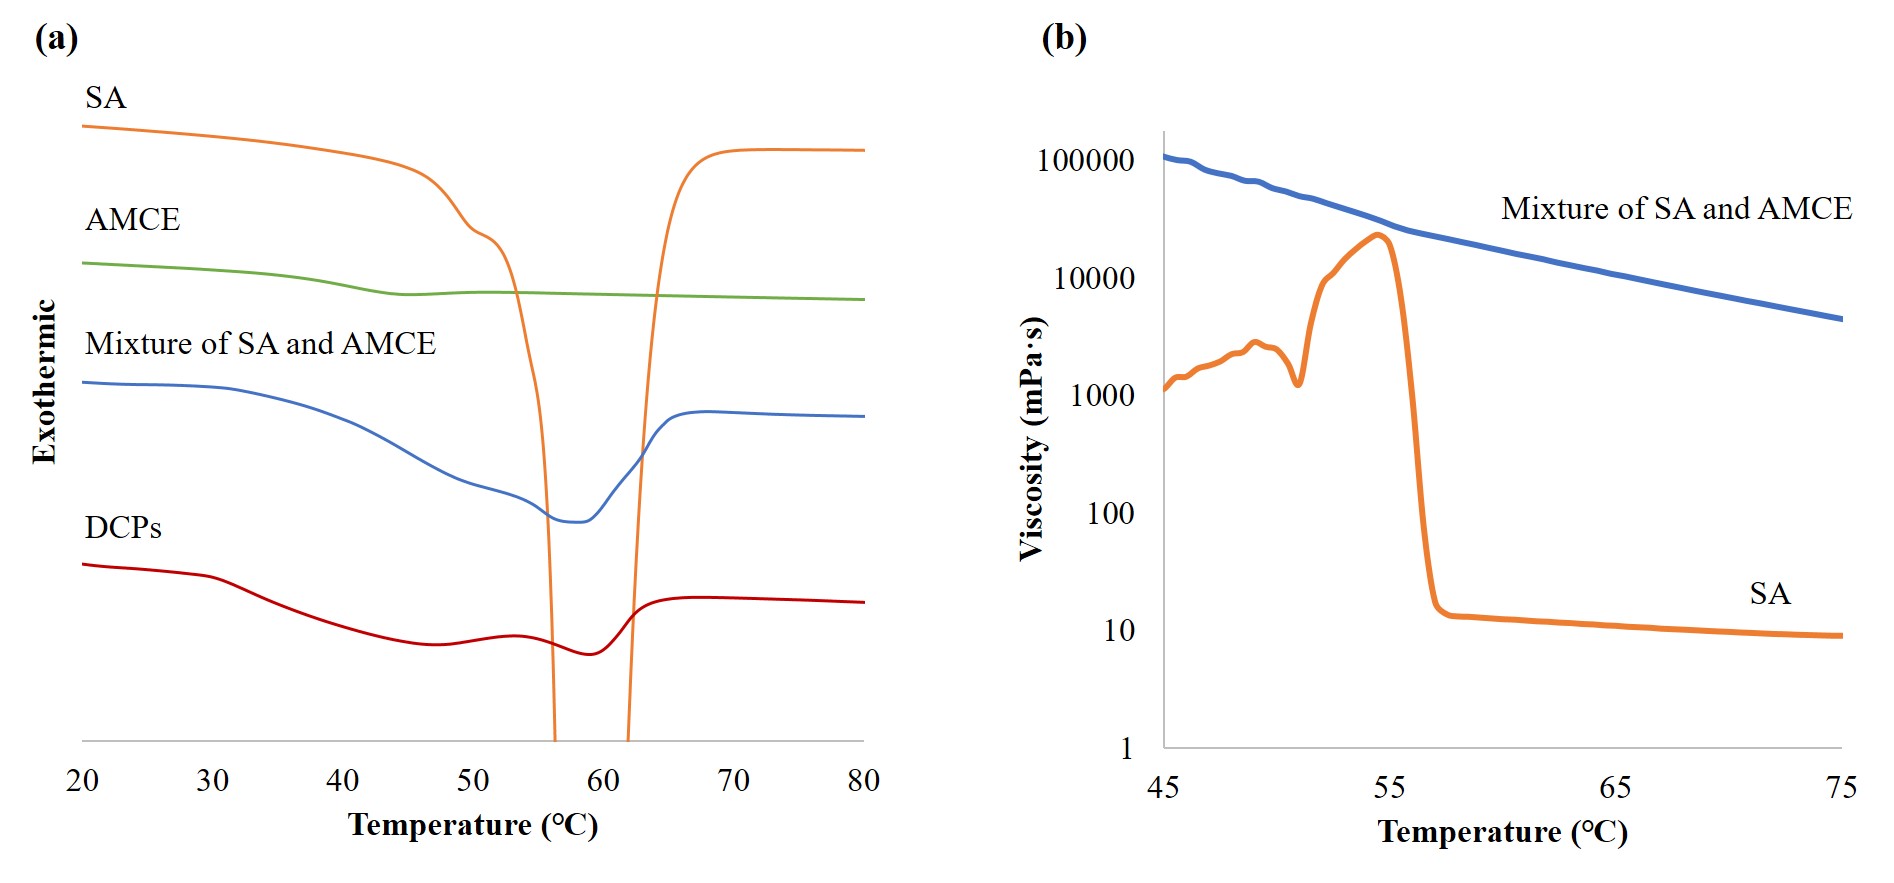 Figure 3. (a)DSC spectra of AMCE, SA, the mixture of SA and AMCE, and DCPs. (b)Viscosity analysis of SA, and the mixture of SA and AMCE.