
Formulation and Delivery - Chemical
Category: Poster Abstract
Tomas Roldan, BA
Rutgers University Ernest Mario School of Pharmacy
Piscataway, New Jersey, United States
Tomas Roldan, BA
Rutgers University Ernest Mario School of Pharmacy
Piscataway, New Jersey, United States
Shike Li, M.D.
Rutgers University Ernest Mario School of Pharmacy
Piscataway, New Jersey, United States
Christophe Guillon, Ph.D.
Lehigh University
Bethlehem, Pennsylvania, United States
Ned D. Heindel, Ph.D.
Lehigh University
Bethlehem, Pennsylvania, United States
Jeffrey D. Laskin, Ph.D.
Rutgers University School of Public Health
Piscataway, New Jersey, United States
Dayuan Gao, Ph.D.
Rutgers University Ernest Mario School of Pharmacy
Piscataway, New Jersey, United States
Patrick J. Sinko, Ph.D.
Rutgers University Ernest Mario School of Pharmacy
Piscataway, New Jersey, United States
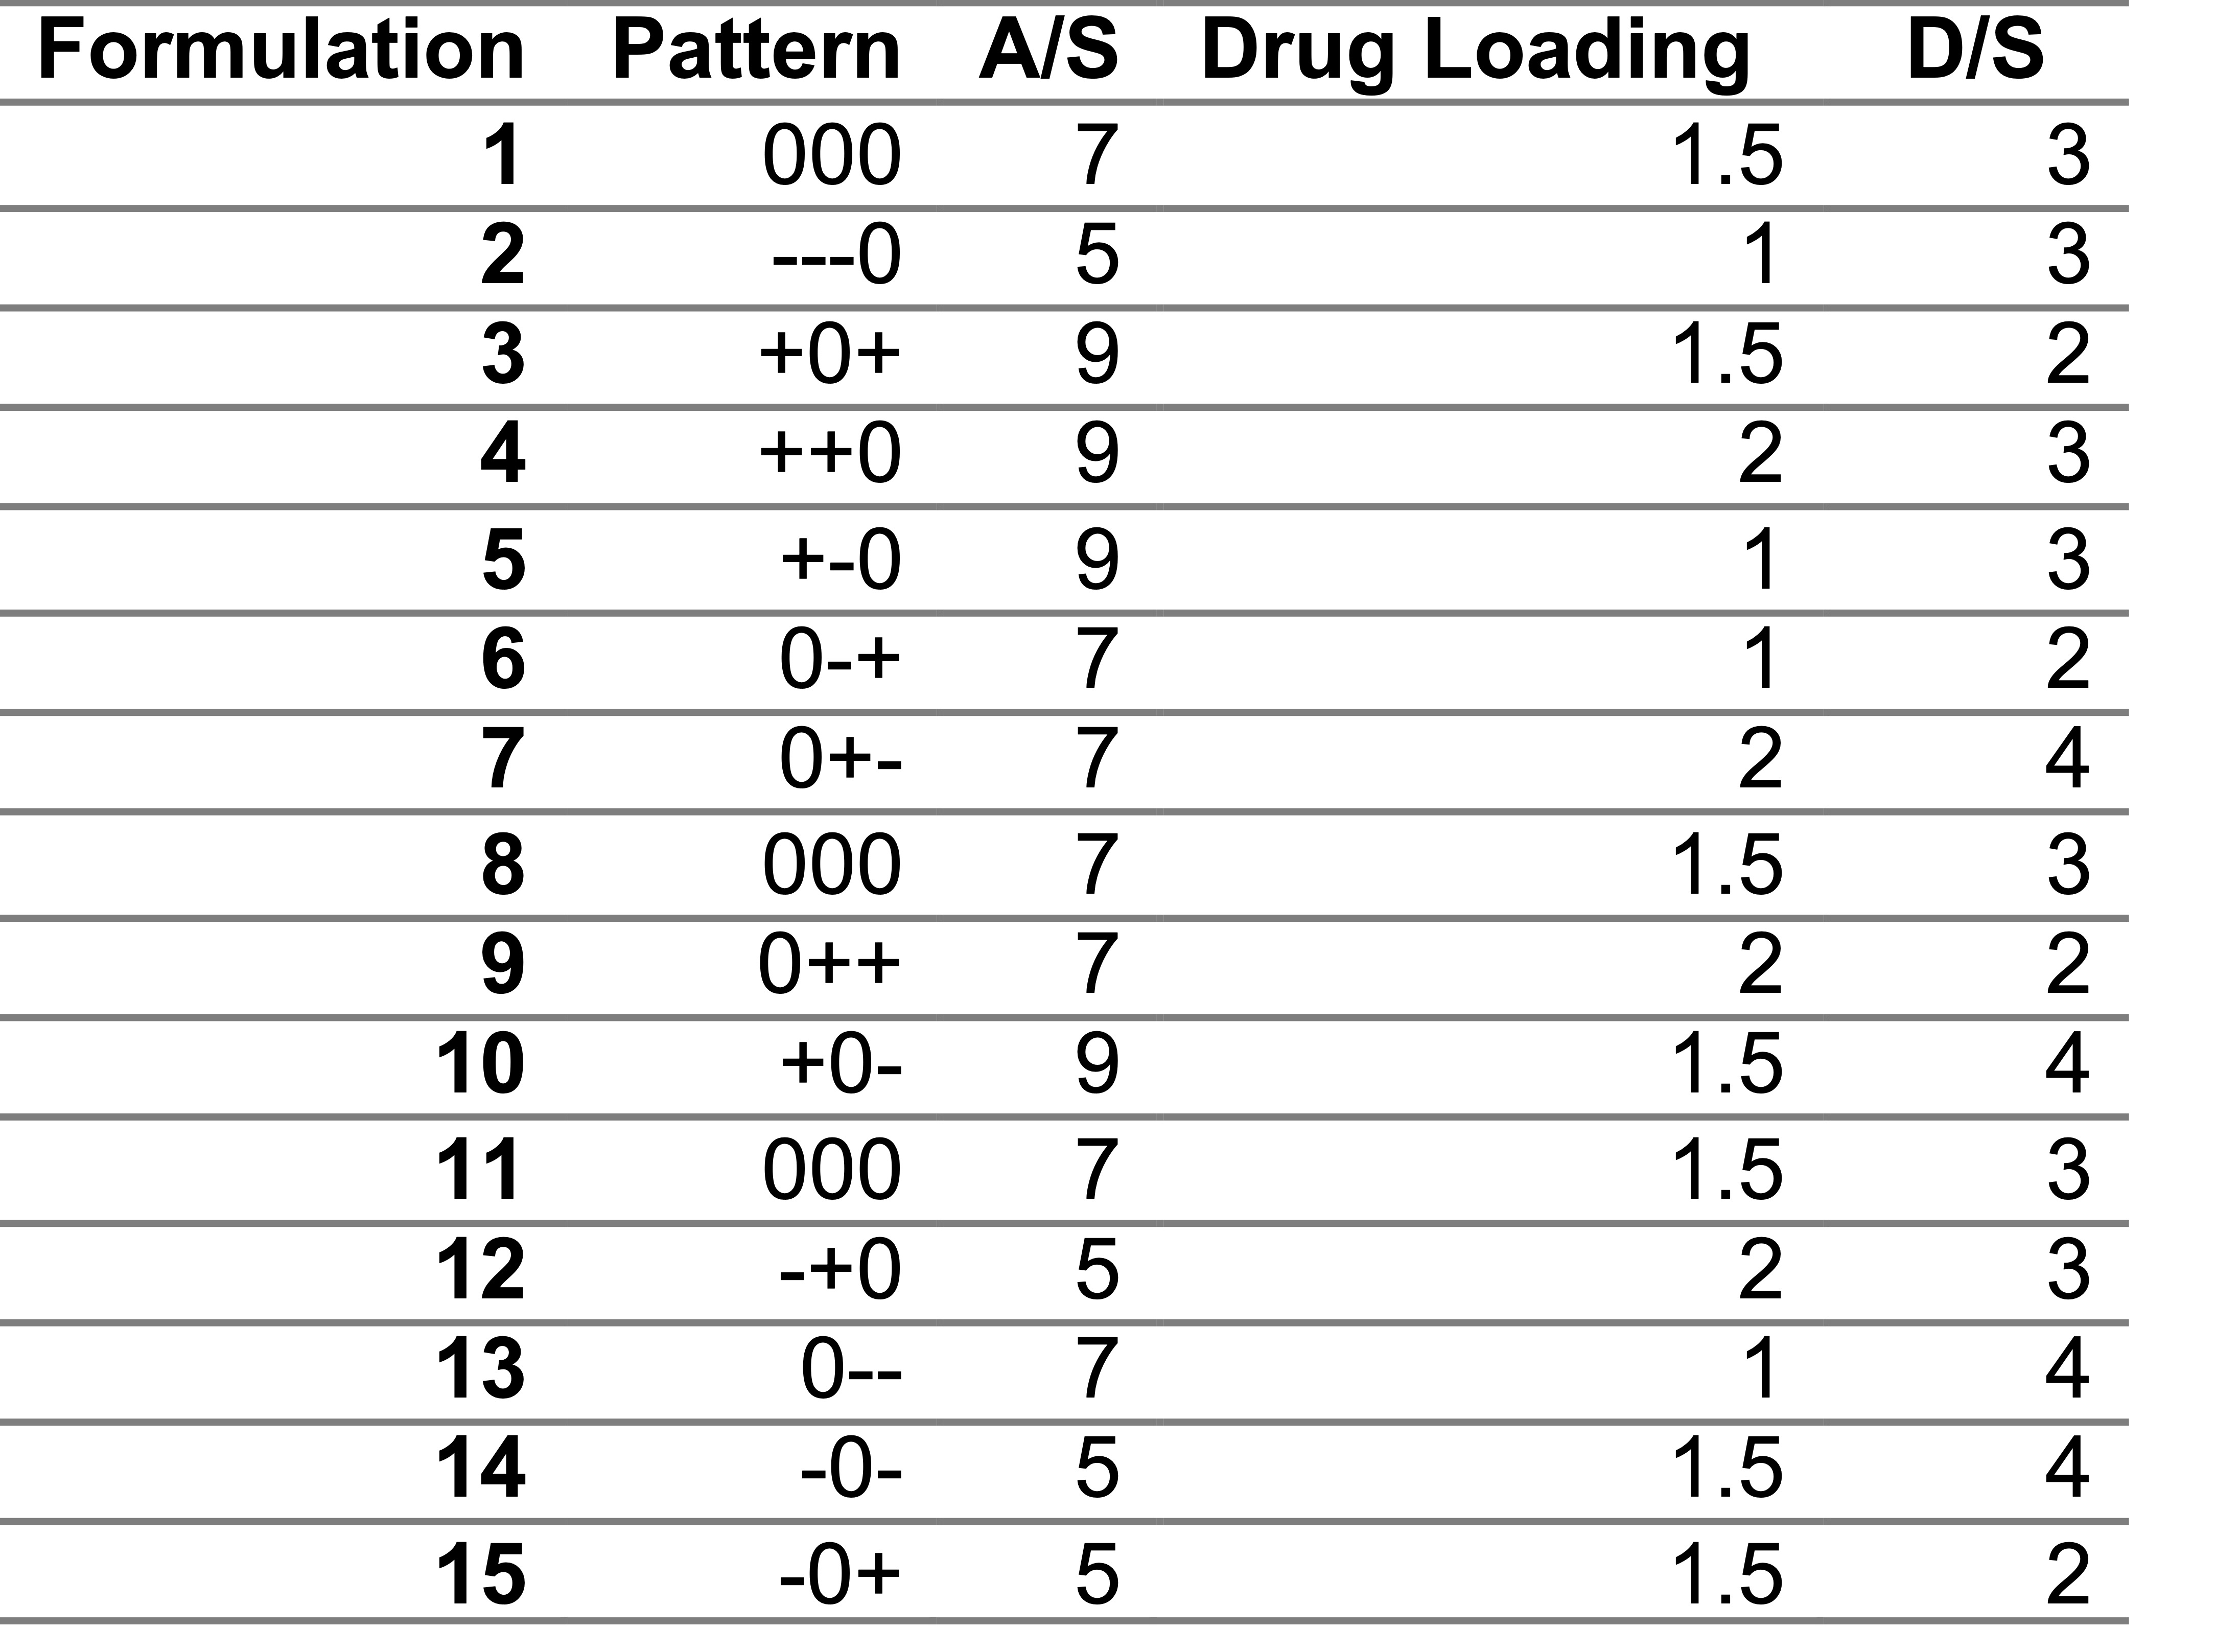 Fig. 1. A Box-Behnken Design (BBD) of experiment was constructed to minimize nanocrystal size. Three critical factors were selected from the initial evaluation data, antisolvent-solvent ratio (A/S), drug loading, and drug-to-stabilizer ratio (D/S). For the experimental design, a BDD was selected, as prediction profilers demonstrate that power analyses of BBDs are better suited at the edges of critical factor ranges than other design types. Using JMP Pro 16, 15 runs were generated with 3 center points.
 .jpg) Fig. 2. Two optimization strategies lowered the predicted drug crystal size and defect rate. By using the maximum desirability function, the defect rate for the optimized factor settings to produce nanocrystals that fall within the 10-50 nm spec limits was lowered from 42.2 to 8.1%. After running a Gaussian process script of the Monte Carlo simulation, the defect rate was further lowered to 6.5%, with the optimal settings being antisolvent/solvent ratio (A/S) of 6.2, drug loading (DL) of 2% w/w, and drug to stabilizer ratio (D/S) of 2.8.
Fig. 2. Two optimization strategies lowered the predicted drug crystal size and defect rate. By using the maximum desirability function, the defect rate for the optimized factor settings to produce nanocrystals that fall within the 10-50 nm spec limits was lowered from 42.2 to 8.1%. After running a Gaussian process script of the Monte Carlo simulation, the defect rate was further lowered to 6.5%, with the optimal settings being antisolvent/solvent ratio (A/S) of 6.2, drug loading (DL) of 2% w/w, and drug to stabilizer ratio (D/S) of 2.8. .jpg) Fig. 3. A Test Equivalence distribution analysis validates the model performance. The crystal sizes of four formulations prepared at the optimal factor settings were determined to be statistically equivalent to the predicted size, with a 95% confidence interval.
Fig. 3. A Test Equivalence distribution analysis validates the model performance. The crystal sizes of four formulations prepared at the optimal factor settings were determined to be statistically equivalent to the predicted size, with a 95% confidence interval.