
Formulation and Delivery - Chemical
Category: Poster Abstract
 photo")
Xinyue Zhang, MS (she/her/hers)
PhD STUDENT
University of Hong Kong
Hong Kong, United Kingdom
Xinyue Zhang, MS (she/her/hers)
PhD STUDENT
University of Hong Kong
Hong Kong, United Kingdom
Shing Fung S.F. Chow, Ph.D. (he/him/his)
University of Hong Kong
HONG KONG, Hong Kong
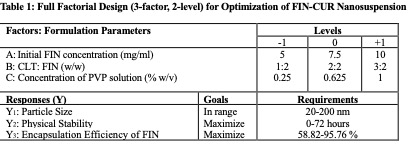 Table 1: Full Factorial Design (3-factor, 2-level) for Optimization of FIN-CUR Nanosuspension
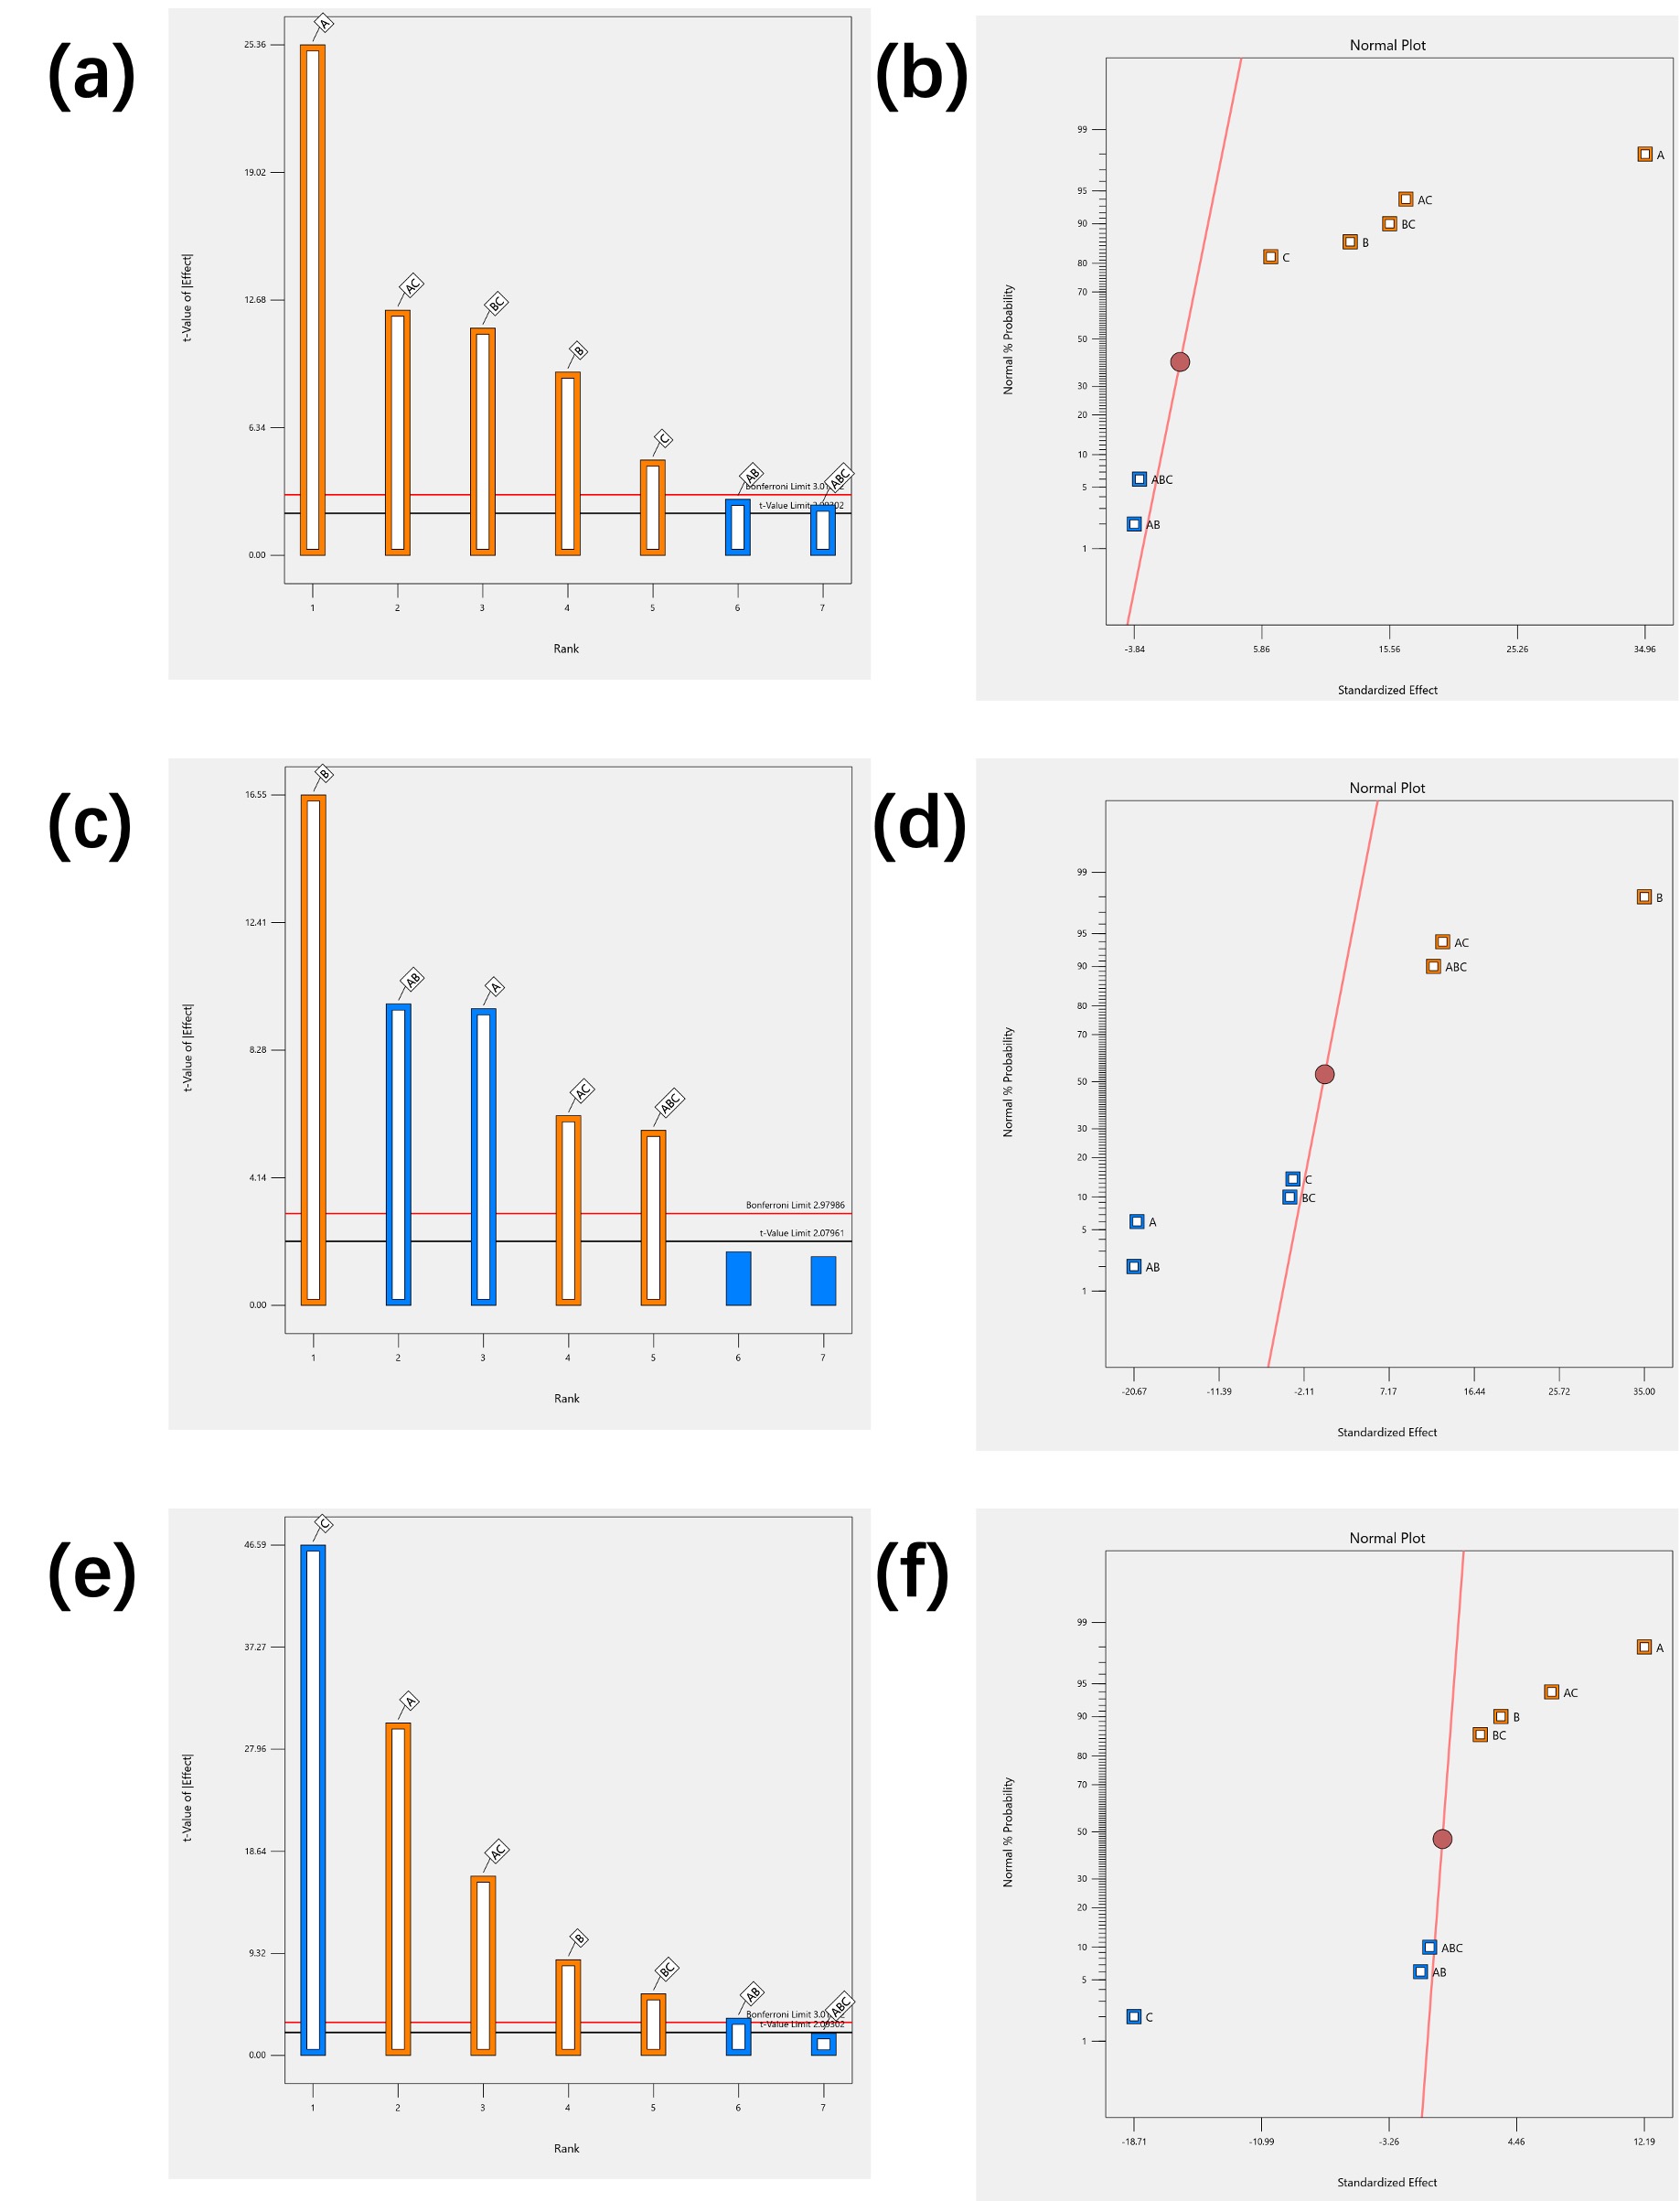 Figure 1: Pareto charts of effects of initial concentration of FIN (A), CLT:FIN ratio (B), concentration of PVP solution (C) and their interactions on particle size (Figure 1 (a)), physical stability (Figure 1 (b)) and EE of FIN (Figure 1 (c)). The factors above the black lines have statistically significant effects on the responses (p < 0.05). Normal probability plots indicate the direction, significance, and magnitude of effects and their interactions on particle size (Figure 1 (b)), physical stability (Figure 1 (d)), and EE of FIN (Figure 1 (f)). Factors with blue or orange bars show negative or positive effects on the responses.
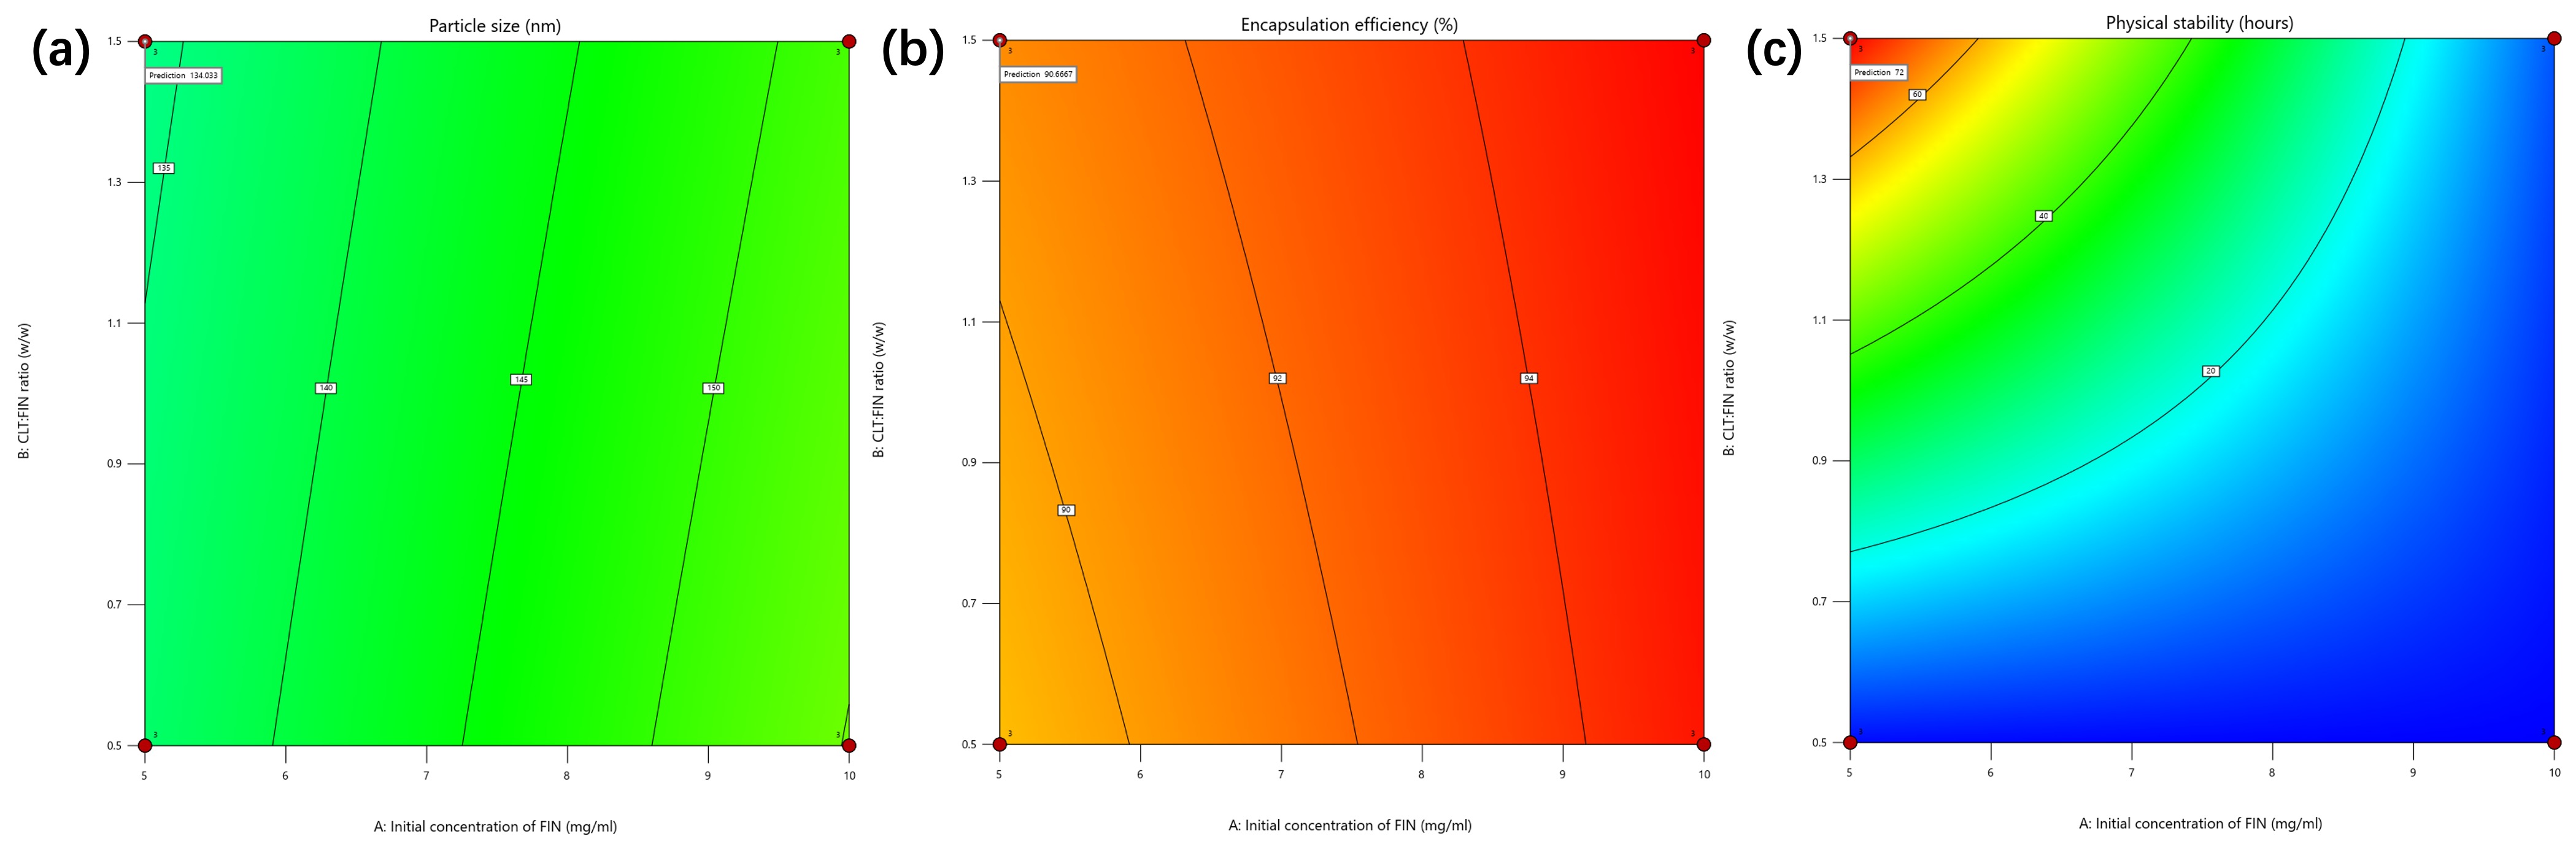 Figure 2: 2D Contour Plots for particle size (Figure 2 (a)), physical stability (Figure 2 (b)), and EE of FIN (Figure 2 (c)) as the initial concentration of FIN (x-axis) and CLT:FIN ratio (y-axis) at a fixed concentration of PVP solution (0.25% w/v). The white boxes show the predicted response values with the highest desirability of the optimized formulation.