Formulation and Delivery - Chemical
Category: Poster Abstract
(T1030-11-70) Amorphous Solid Dispersions of Cinnarizine – The Influence of Polymer Type and Manufacturing Method on Drug Solubility, Partition Coefficient and Stability
Tuesday, October 24, 2023
10:30 AM - 11:30 AM ET

Selina Schmidt (she/her/hers)
Research Assistant / PhD Student
University of Applied Sciences Cologne
Leverkusen, Nordrhein-Westfalen, Germany
Selina Schmidt (she/her/hers)
Research Assistant / PhD Student
University of Applied Sciences Cologne
Leverkusen, Nordrhein-Westfalen, Germany- HS
Heiko A. Schiffter (he/him/his)
University of Applied Sciences Cologne
Leverkusen, Nordrhein-Westfalen, Germany
Presenting Author(s)
Main Author(s)
Co-Author(s)
Purpose: Poorly water-soluble drugs can be formulated as amorphous solid dispersions (ASDs) with polymers to increase their solubility or to stabilise a supersaturated state. In this study, the solubility of cinnarizine was investigated in polymer solutions. ASDs were prepared by hot melt extrusion (HME) and spray-drying (SD). Both solubility enhancement and ASD stability can give hints on molecular interactions.
Methods: Solubility and logP Solubility testing was performed by adding an excess of cinnarizine to hydrochloric acid (HCl, 0.01 mM – 0.1 M) or phosphate buffer pH 6.8 (0.15 M) with or without 50 mg/mL polymer. After stirring for 72 hours, the pH was measured. Aliquots were centrifuged at 12,000 rpm for 15 minutes and diluted (1:1). Samples were analysed by HPLC-PDA using a 250 mm C18-column at 40 °C. The mobile phase consisted of methanol, acetonitrile and 0.1 % triethylamine (8:1:1, pH 7.8) at a flow rate of 0.5 mL/min. Quantitation of cinnarizine was done at 249 nm by external calibration. For logP-determination, octanol with cinnarizine (10 mg/mL) was added into tubes with polymer solutions or buffer. The tubes were left for 94 hours without shaking to avoid precipitation of polymer in octanol. Aliquots were processed as described above. Manufacturing For HME, a binary mixture of drug and polymer was added into a 9 mm (co-rotating) hot melt extruder (20:1) (ZE 9 HMI, ThreeTec) with three heating zones. Temperature settings depended on the processed polymer. Extrudates were ground using a mortar and pestle. For SD, drug and polymer were dissolved in methanol. Spraying was performed using an S-300 Mini Spray Dryer with S-396 inert loop (both Büchi AG) at 80 °C inlet temperature, a pump speed of 3.00 mL/min and a spray gas rate of 450 L/h. For both methods, the drug:polymer-ratio was 1:1 by mass. Differential Scanning Calorimetry (DSC) and X-ray Powder Crystallography (XRPD) ASDs and raw materials were characterised using a DSC (Q2000, TA Instruments). Samples were treated with a heat-cool-heat cycle with a heating rate of 10 K/min. For XRPD-analysis, a D2 Phaser by Bruker was used. Polymers The polymers tested included methacrylic acid – ethyl acrylate copolymer (1:1) (MAEA), methacrylic acid – methyl methacrylate copolymer (1:1) (MAMM), basic butylated methacrylate copolymer (BBM), hypromellose acetate succinate (HPMCAS), hypromellose (HPMC), copovidone (CP), polyvinyl acetate phthalate (PVAP), shellac, polyacrylic acid (PA), and polyethylene glycol 6000 (PEG).
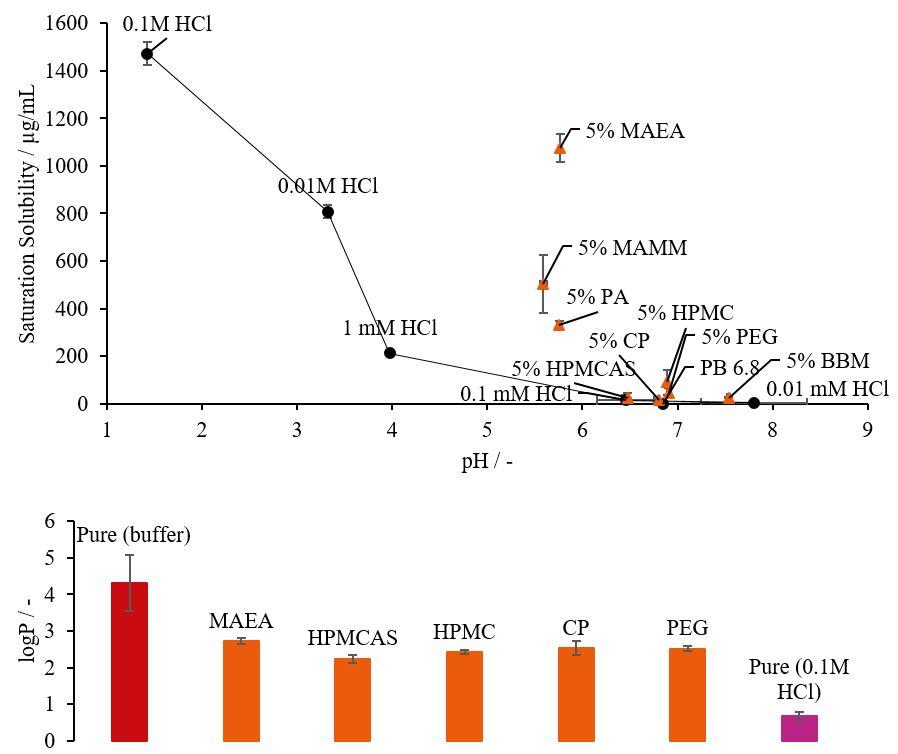
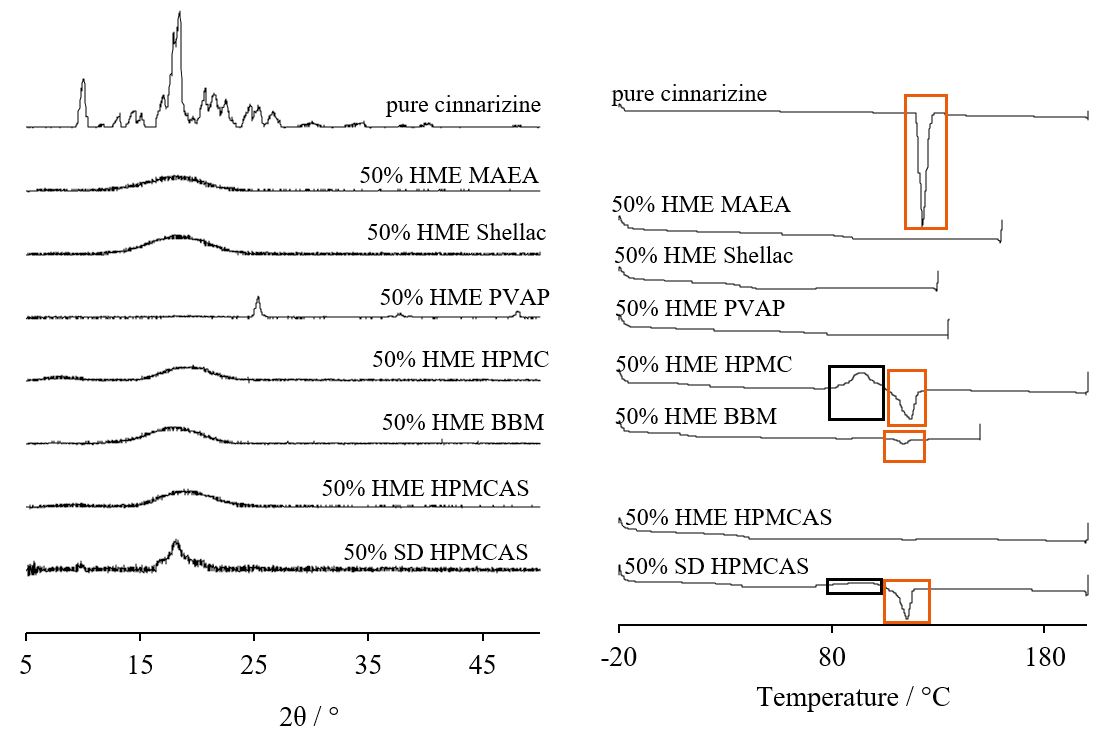
Results: Figure 1 shows the influence of the polymer types on drug saturation solubility. Compared with the pH-dependent solubility, most polymers increased the solubility significantly (p < 0.05), except for PEG, HPMC and HPMCAS. The increase in solubility was larger for polymers with acidic functional groups compared to neutral or basic structures. No increase in saturation solubility was detected for HPMCAS. In the modified logP measurements, a decrease of the logP value was observed for all polymers added to the aqueous phase. Neither acidic or basic polymer properties nor pH or solubility changes influenced the partition coefficient. All ASDs prepared by HME were X-ray amorphous. However, the ASD containing BBM displayed a small melting event in DSC analysis. With HPMC, a recrystallization peak was followed by a melting event, which implied that the drug was amorphous at first, but the polymer was not able to stabilise this status at elevated temperatures. All polymers with acidic functional groups could form stable ASDs with the weakly basic cinnarizine by HME. In spray drying, it was not possible to form an HPMCAS-containing ASD with completely amorphous cinnarizine at 50 % drug load (see Figure 2). During the process, the product was exposed to outlet and product temperatures of 60 °C and 48 °C, respectively. In contrast, ASDs produced by HME were removed from the process immediately after manufacture and were allowed to cool down to room temperature.
Conclusion: Saturation solubility testing and DSC-/XRD-analysis of ASDs showed that acidic polymers have a higher potential to interact with and stabilise the amorphous state of cinnarizine. With BBM and HPMC, no stable ASDs were formed at 50 % (w/w) drug load. HPMCAS did not have an impact on cinnarizine solubility and could not form a stable ASD in spray drying. Regardless of the polymer properties in terms of their acidic or basic character, the distribution between octanol and aqueous phase was influenced to comparable extends.
References: [1] K. Sarpal et al., “Investigation into Intermolecular Interactions and Phase Behavior of Binary and Ternary Amorphous Solid Dispersions of Ketoconazole,” Molecular pharmaceutics, vol. 17, no. 3, pp. 787–801, 2020, doi: 10.1021/acs.molpharmaceut.9b00970.
[2] B. Wang et al., “pH-Dependent supersaturation from amorphous solid dispersions of weakly basic drugs,” Pharmaceutical research, vol. 28, no. 11, pp. 2919–2936, 2022, doi: 10.1007/s11095-021-03147-0.
 Figure 1: Saturation solubility and logP values of cinnarizine. Top: Saturation solubility of weakly basic cinnarizine depending on pH and polymer type. The black line shows the pH-dependent drug solubility. The orange dots show the drug solubility in 50 mg/mL polymer solutions. Bottom: logP values of cinnarizine depending on polymer type in the aqueous phase. The values displayed are the mean (n = 3) and the error bars represent the standard deviation.
 Figure 2: XRD and DSC analysis of cinnarizine ASDs. Diffractograms (left) and DSC thermograms (right, exothermal events upwards, first heating cycle) of cinnarizine ASDs in comparison to the crystalline raw material. Black boxes show recrystallization events and orange boxes melting events.