
Manufacturing and Analytical Characterization - Chemical
Category: Poster Abstract

Christopher Kossor
PhD Student
New Jersey Institute of Technology
Kenilworth, New Jersey, United States
Christopher Kossor
PhD Student
New Jersey Institute of Technology
Kenilworth, New Jersey, United States
Rajesh Davé, Ph.D.
New Jersey Institute of Technology
Newark, New Jersey, United States
.jpg) Figure 1. X-Ray Powder Diffraction (XRPD) diffractograms of three GF-HPC blends at 3 HME temperatures and physical mixtures: a) 10% GF and 90% HPC, b) 20% GF and 80% HPC, and c) 30% GF and 70% HPC.
Figure 1. X-Ray Powder Diffraction (XRPD) diffractograms of three GF-HPC blends at 3 HME temperatures and physical mixtures: a) 10% GF and 90% HPC, b) 20% GF and 80% HPC, and c) 30% GF and 70% HPC.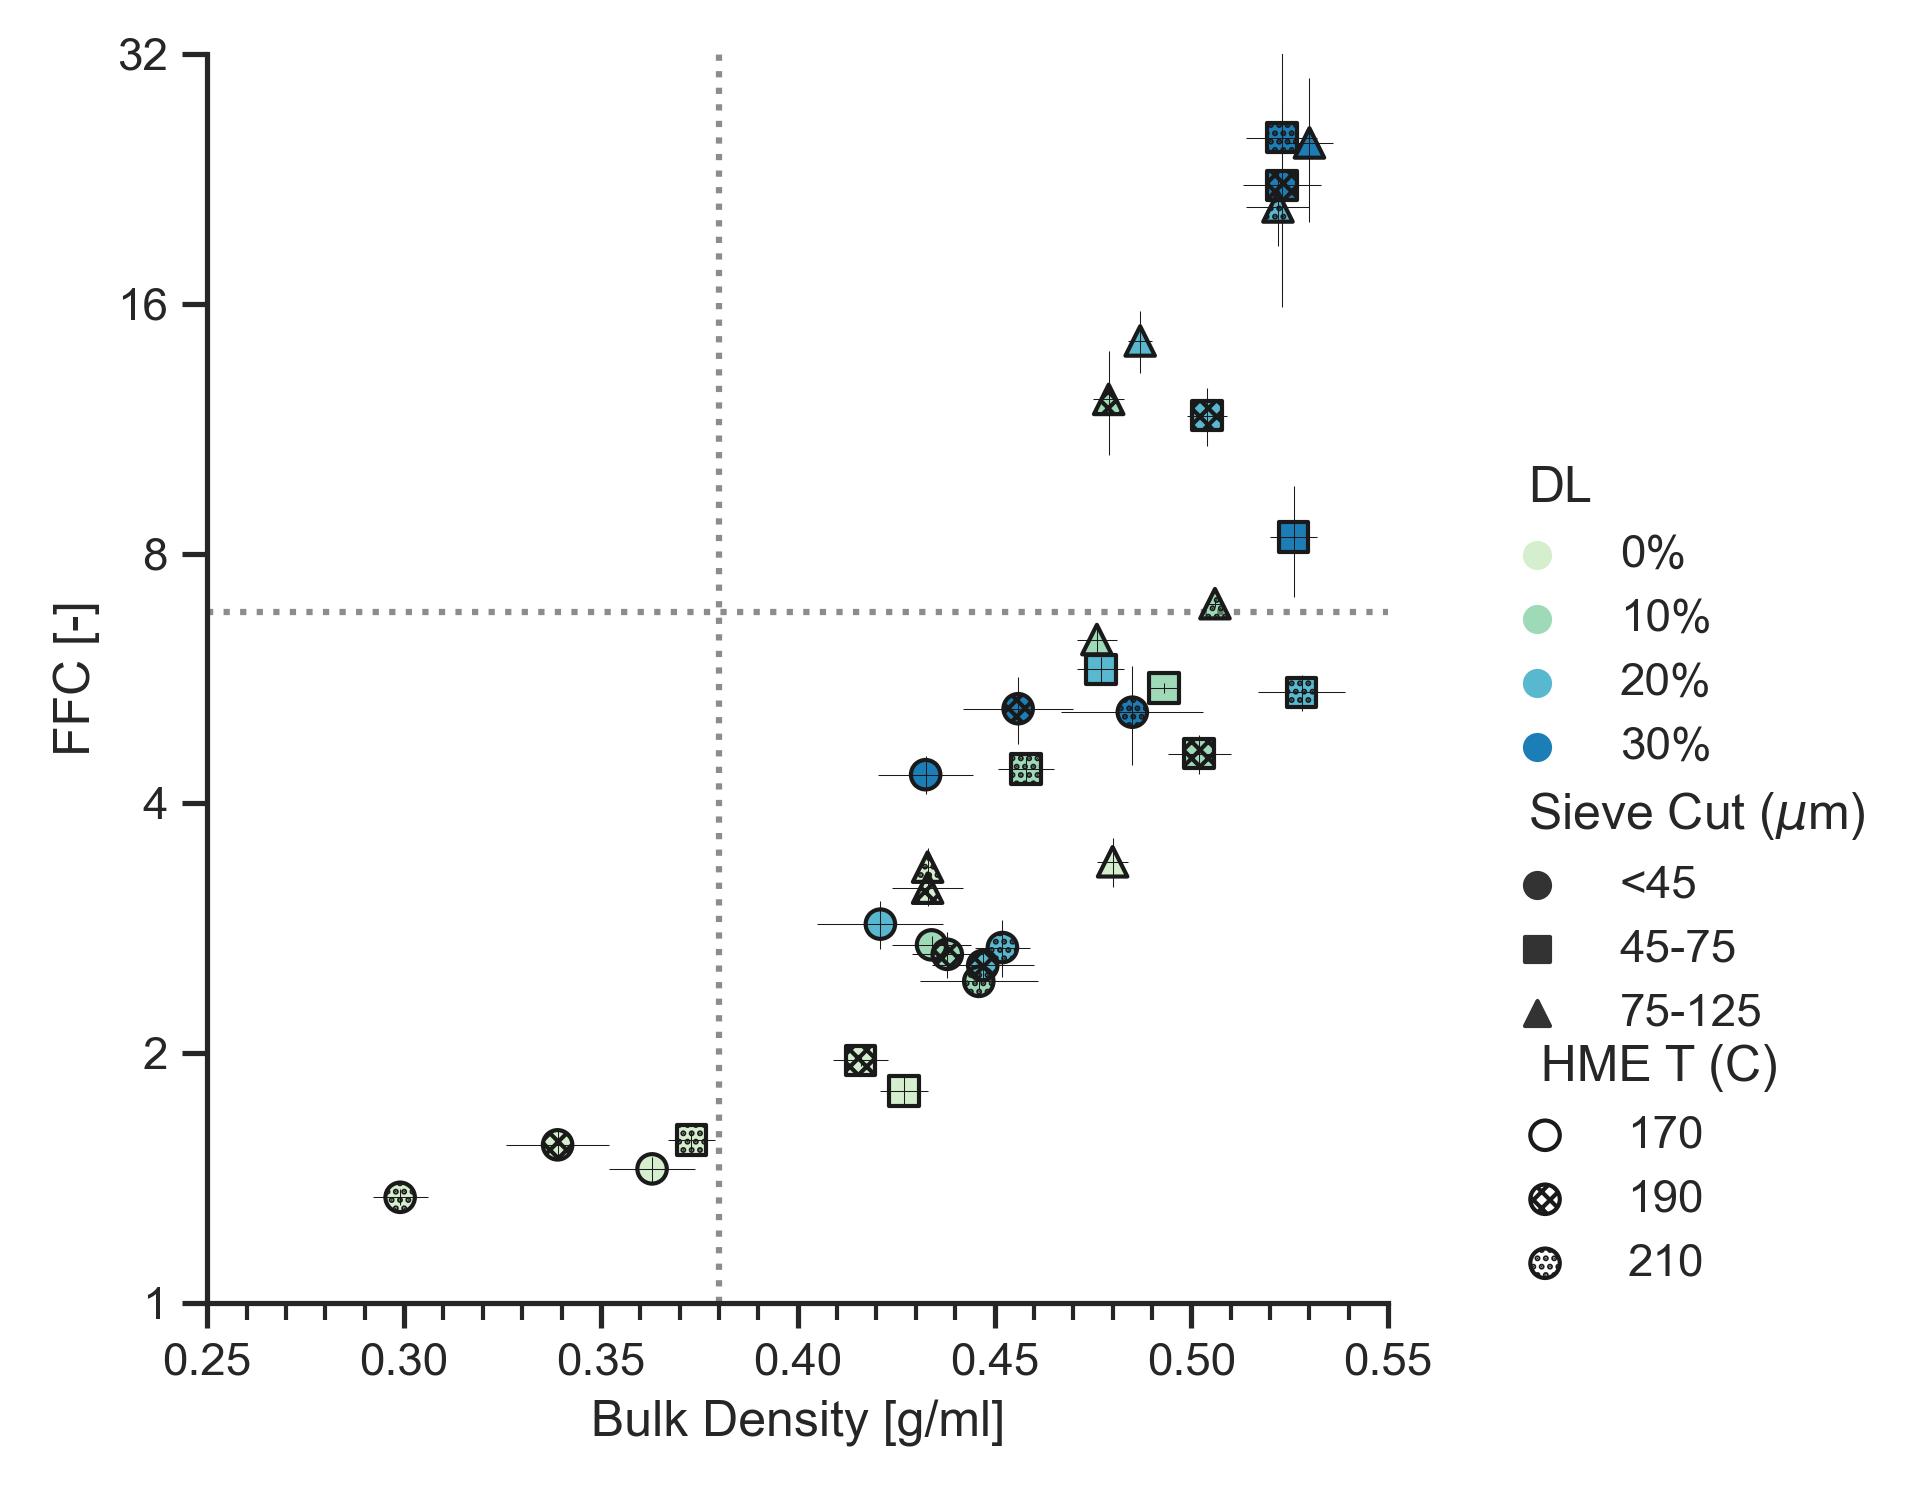 Figure 2. Flowability Function Coefficient (FFC) and bulk density plot of exemplary milled HME extrudate powders. The varying colors represent four drug loadings of GF. The varying marker shapes represent three difference sieve cut sizes. The varying hatch infills represent the three HME operating temperatures.
 .jpg) Figure 3. Scanning Electron Microscope (SEM) images of 30% GF drug loading, < 45 μm sieve cut at two HME operating temperatures: a) 210°C and b) 170°C.
Figure 3. Scanning Electron Microscope (SEM) images of 30% GF drug loading, < 45 μm sieve cut at two HME operating temperatures: a) 210°C and b) 170°C.