Preclinical and Translational Sciences - Biomolecular
Category: Poster Abstract
(T1130-10-68) EGFR-Targeted Nanoliposomes of Synergistic Oncogenic Protein Degrader Combination: Significant Inhibition of Tumor Growth in Lung-Tumor Bearing Mice
Tuesday, October 24, 2023
11:30 AM - 12:30 PM ET
- RV
Richa Vartak, Ph.D.
Graduate Student
St. John's University
Queens, New York, United States - RV
Richa Vartak, Ph.D.
Graduate Student
St. John's University
Queens, New York, United States - KP
Ketan Patel, Ph.D.
St. John's University
Jamaica, New York, United States
Presenting Author(s)
Main Author(s)
Co-Author(s)
Purpose: Traditional cancer therapies can progressively become ineffective leading to enhanced prevalence of drug-resistant tumors, thereby necessitating exploration of new treatments. Cancer is a heterogeneous cell disease, and this is often the source of resistant cells. Therefore, various stratagems are explored to overcome the resistance by either targeting alternative pathways for inhibiting tumor proliferation or choosing novel therapeutic molecules like PROteolysis Targeting Chimeras (PROTACs) instead of inhibitors. Considering 60 % of non-small cell lung cancer (NSCLC) express EGFR, it has evolved as an important therapeutic target for patients, however, well-established EGFR inhibitors tend to promptly develop resistance. Combination therapies are known to potentially reduce drug resistance, while simultaneously providing therapeutic anti-cancer benefits and plummeting off-target complexities. Based on critical interplay between oncogenic drivers EGFR, c-MYC and K-Ras, we hypothesize simultaneous degradation instead of inhibition of EGFR and BRD4 using “PROTACs” could be a universal panacea for NSCLC. Moreover, it can prove to be advantageous for both EGFR-TKI-sensitive and mutant NSCLC patients. We hypothesized that degradation of oncoprotein and combinatorial therapy could potentially yield more lasting inactivation of downstream pathways thereby circumventing the “kinome rewiring” effect. Therefore, our research aimed at (i) Evaluating a novel EGFR and BRD4-degrading PROTACs combination i.e., EPRO and BPRO for NSCLCs. (ii) Co-delivering them parenterally within biocompatible, EGFRpeptide-targeted nano-liposomes (T-BEPRO). (iii) Evaluating T-BEPRO in-vitro and in-vivo in NSCLC tumor xenograft model. Even if there are numerous reports on combinatorial therapies, this is the first study aiming to combine two PROTACs.
Methods: Considering numerous variants of lung carcinoma, in vitro cytotoxicity of the degraders i.e., BPRO and EPRO was evaluated in three subtypes of NSCLC cell lines i.e., EGFR-TKIs sensitive, wild type/KRAS mutated and EGFR-TKIs resistant cells using MTT and individual IC50s were calculated. A direct comparison of degraders with their inhibitors JQ1 and Gefitinib was performed. Efficacy of combination was tested at different ratios to determine synergism using Chou-Talalay and Combenefit assay. The mechanism of PROTAC degradation was confirmed using EGFR activation assay and ELISA. Comparative anti-metastatic efficacy of combination was assessed by 2D culture assays like migration and colony formation. Based on the observed potency, BPRO and EPRO at 1 mg/mL were loaded in nanoliposomal carrier at optimized lipid ratio using modified hydration method. The liposomes were actively targeted with EGFR-targeting peptide using DGS-NTA Ni conjugation(T-BEPRO). T-BEPRO was characterized for particle size, polydispersity index, encapsulation efficiency and further tested for cellular uptake. T-BEPRO was intended to be administered via parenteral route and therefore was assessed for hemolysis and microsomal activity on half-life. Apoptosis potential was computed using flow cytometry. NT-BEPRO and T-BEPRO were also tested in 3D spheroid model at nanomolar concentrations of BE-PRO combination. Lastly, all the formulations were evaluated in the H1650-based tumor xenograft model. Tumor growth rate kinetics and various in vivo anticancer activity scores were calculated for all treatment groups.
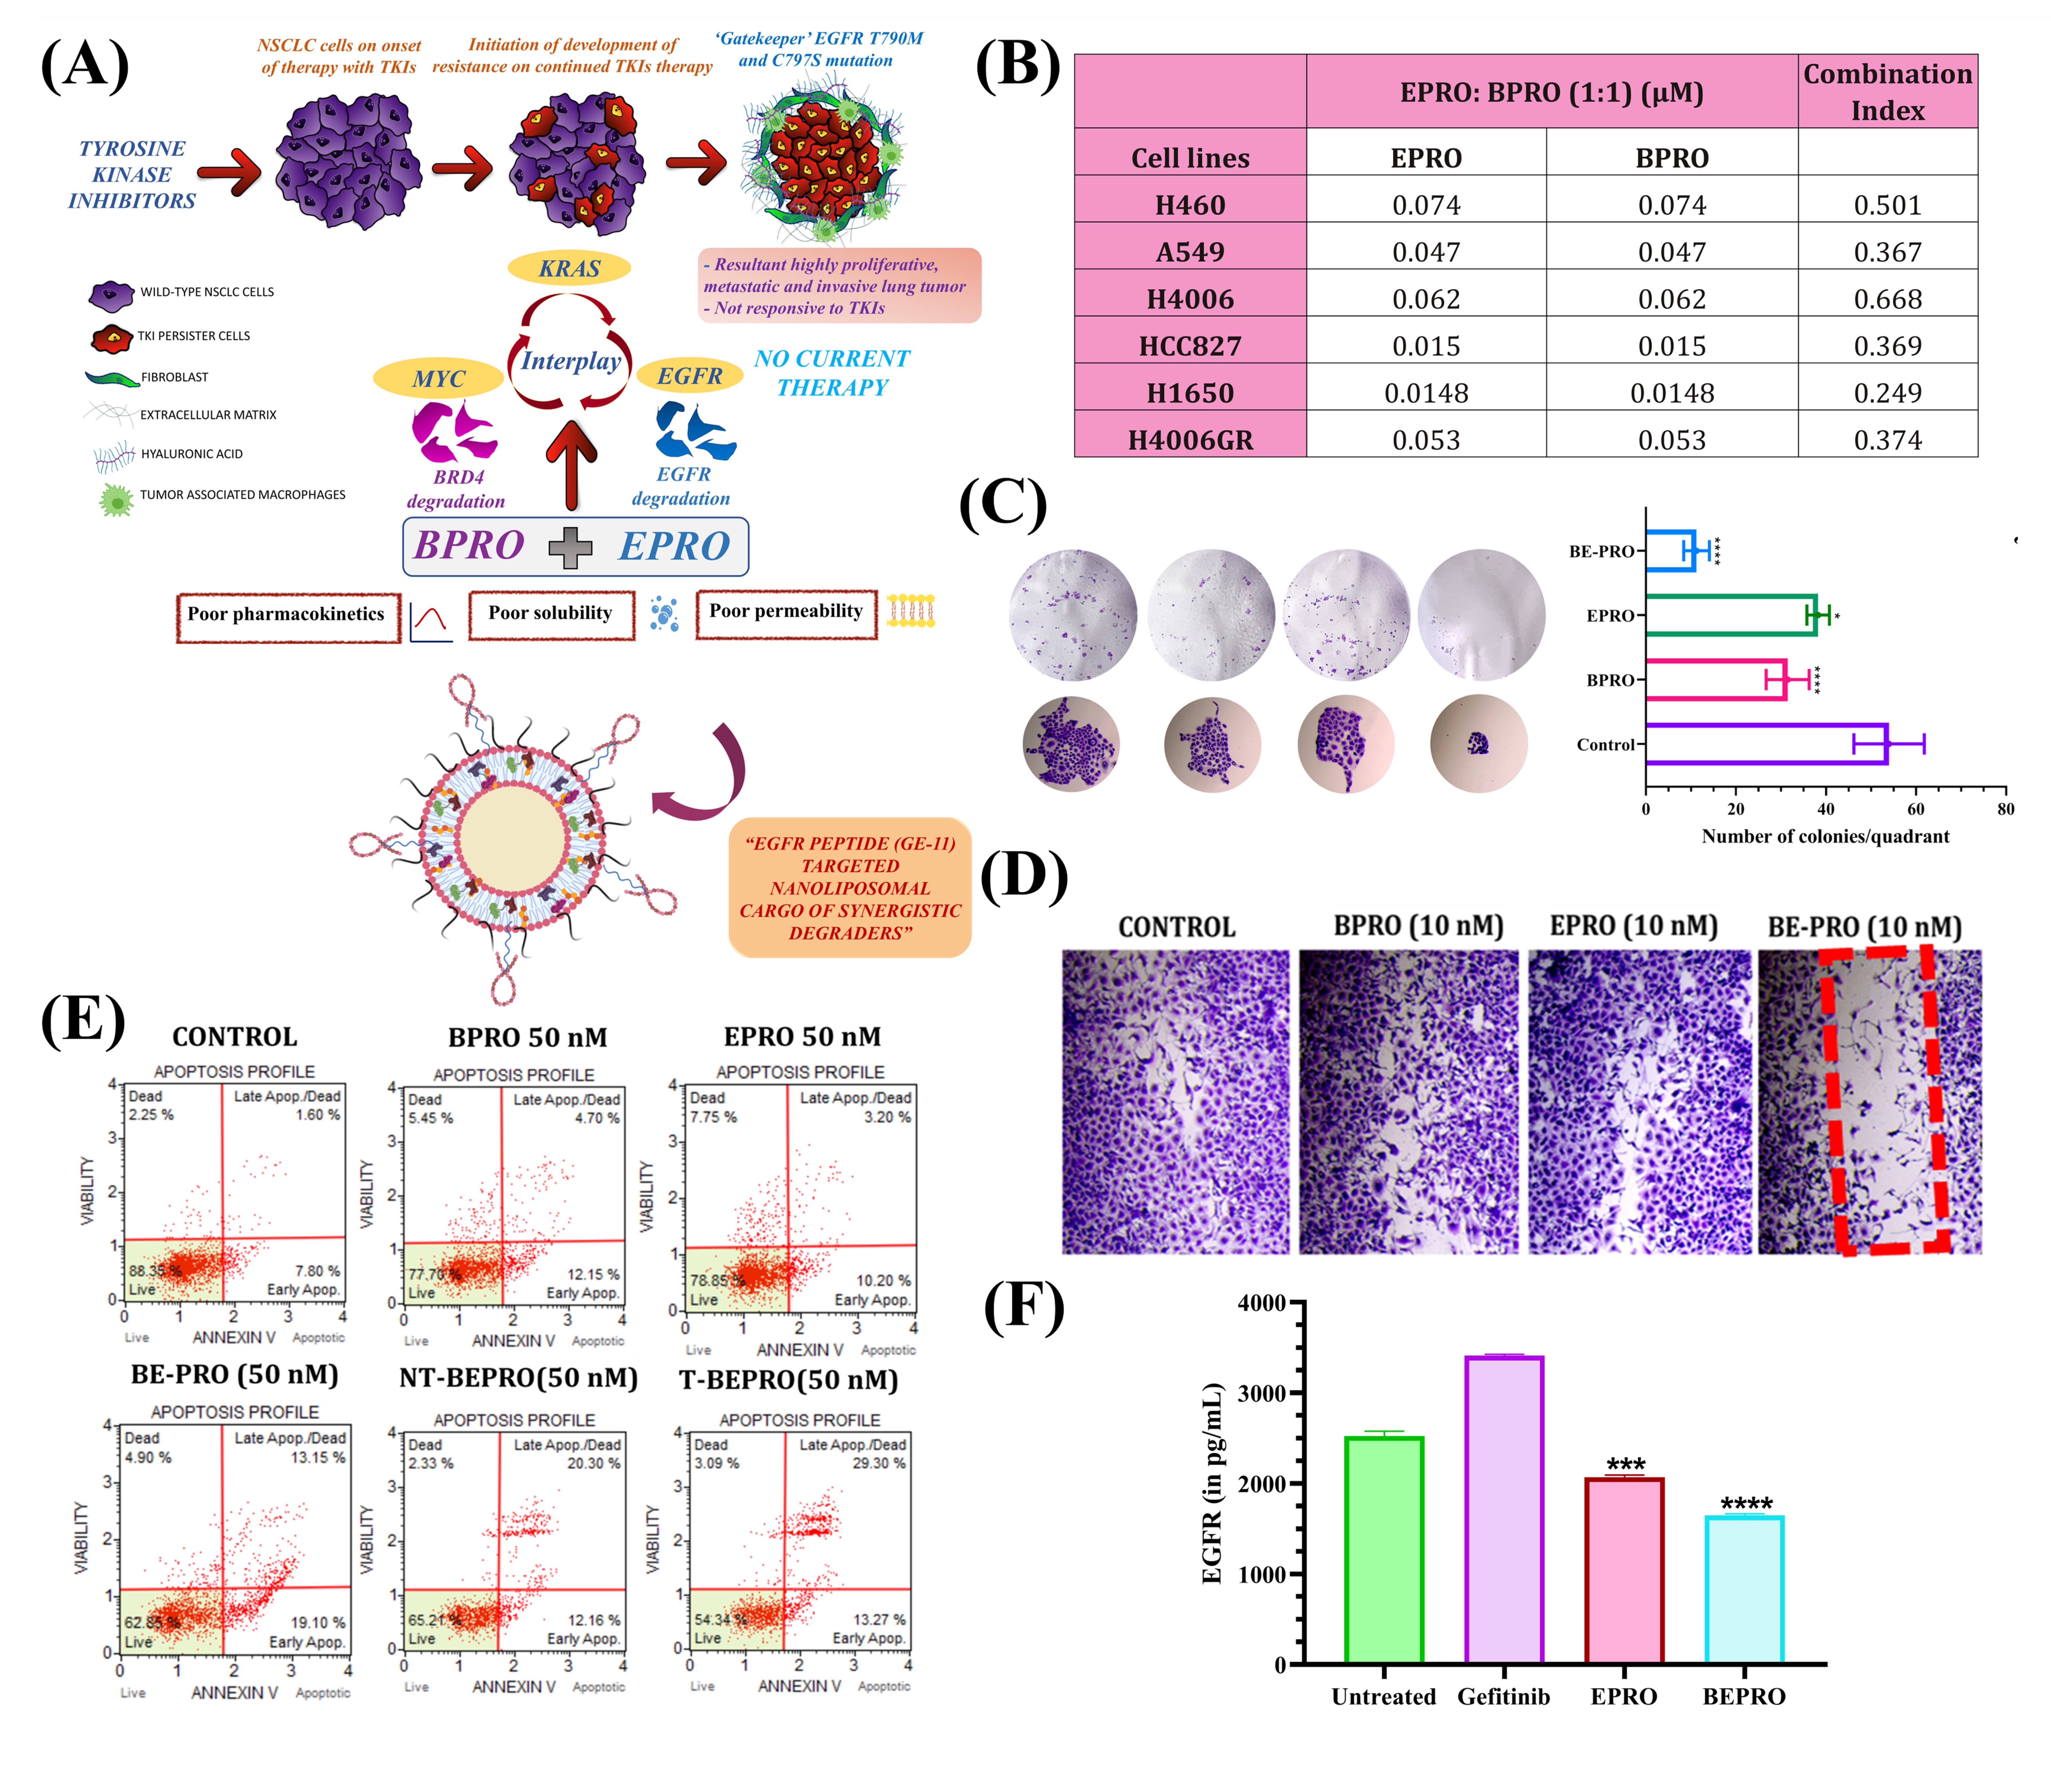
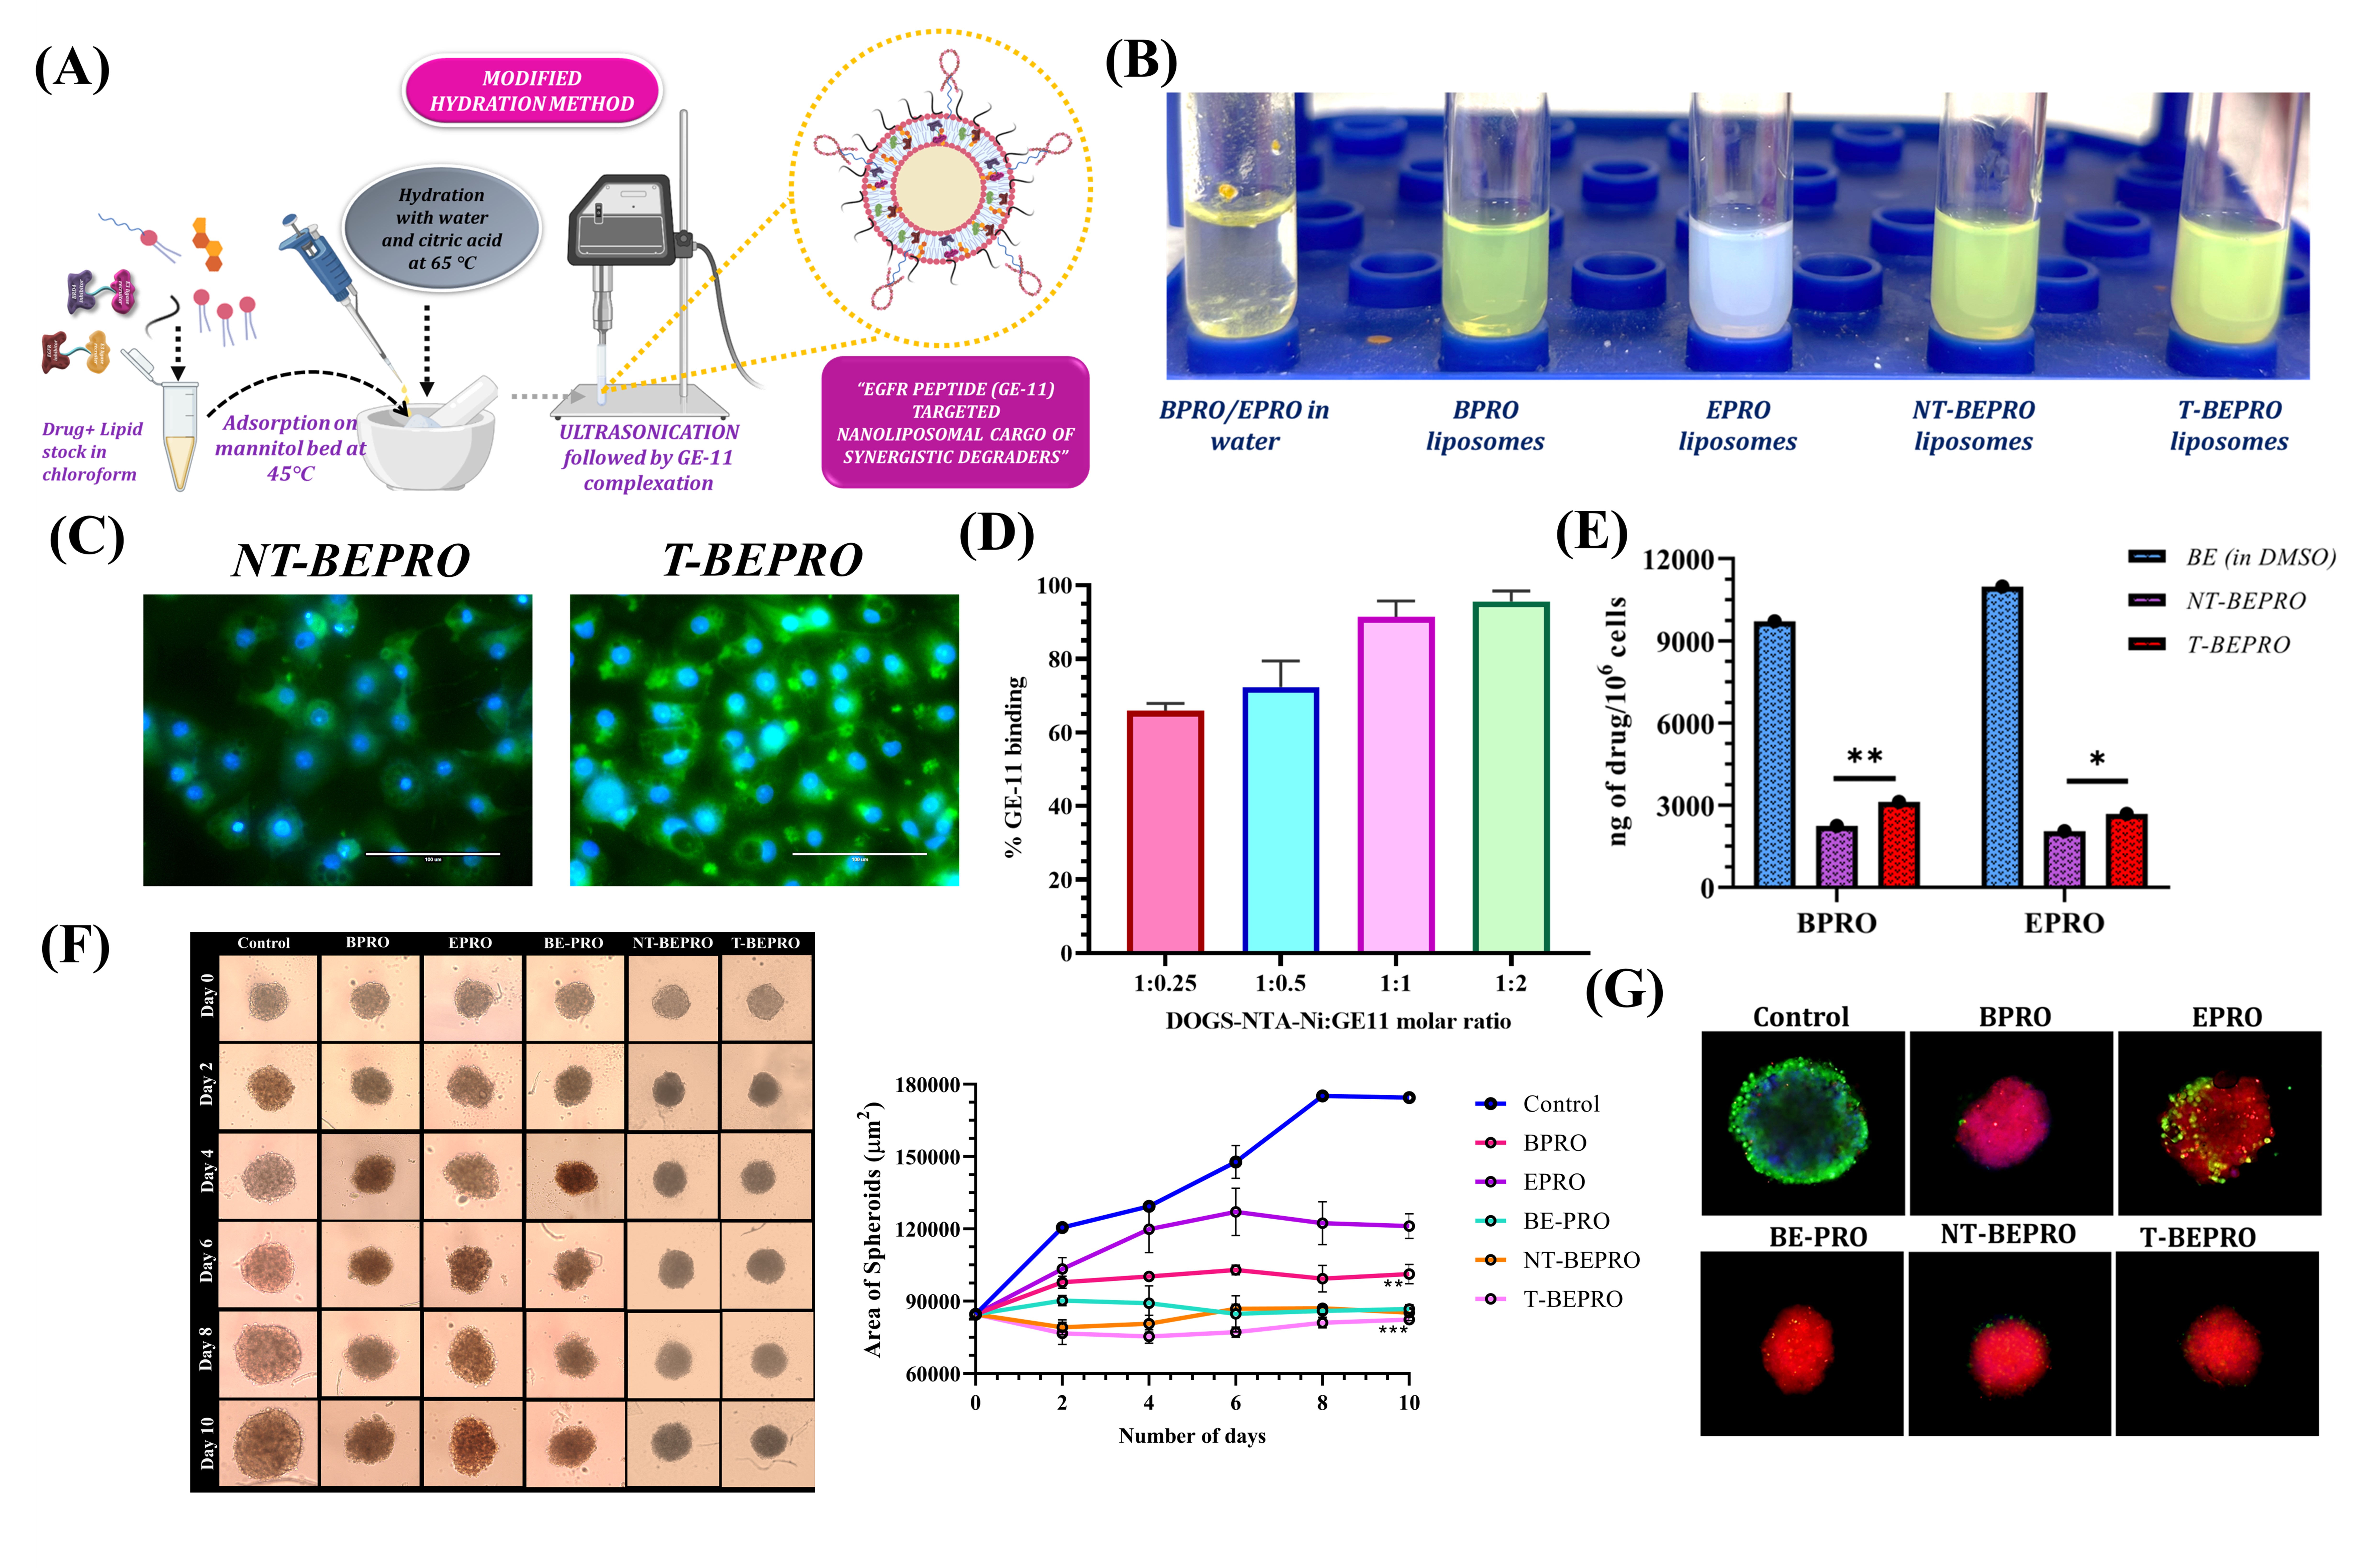
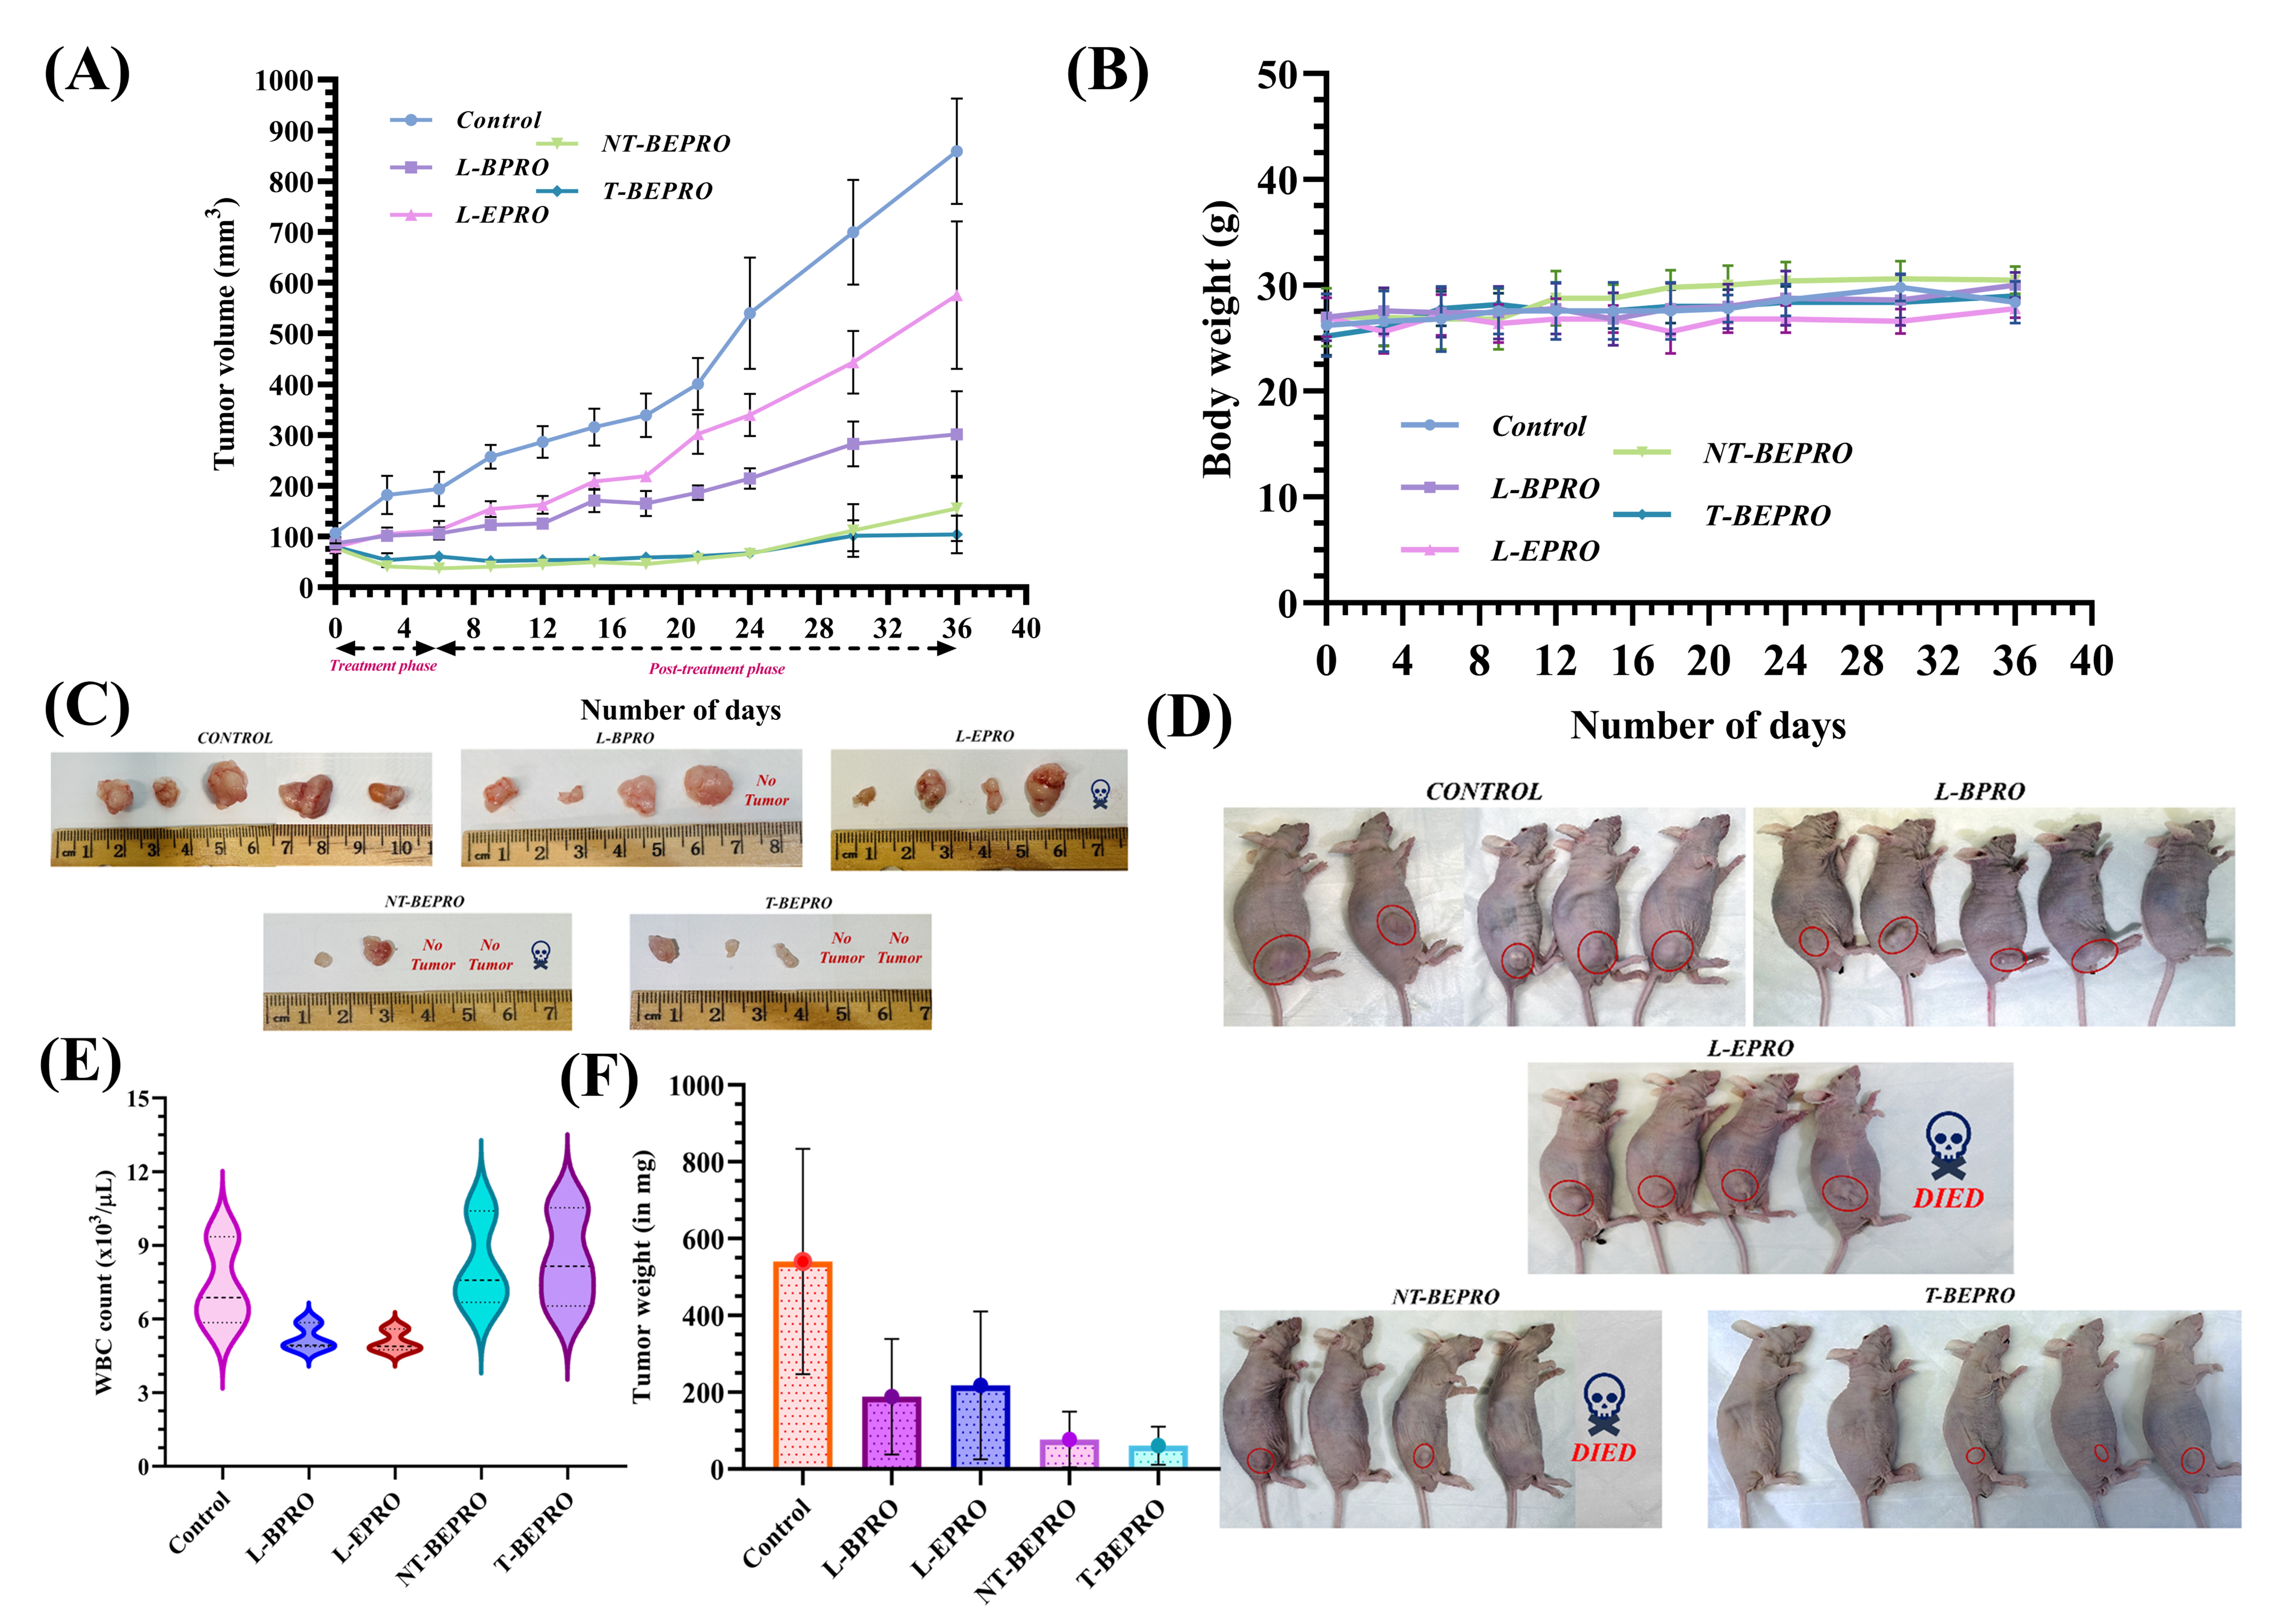
Results: BPRO and EPRO showed nearly 30-500 folds higher potency than their respective inhibitors, JQ1 and Gefitinib in all cell types. Compared to the individual IC50s, a strong synergism was observed at 1:1 combination ratio. Highest synergism with CI of 0.249 in the EGFR-TKI resistant cell line i.e., H1650. EGFR activation assay revealed 47.60 % EGFR non-expressing cells confirming the EGFR-degrading potential of EPRO. For ELISA, lower EGFR levels compared to control were observed. Successful entrapment of 1 mg/mL BPRO and EPRO was achieved in T-BEPRO liposomes with 98% encapsulation efficiency. Moreover, around 95% peptide conjugation could be achieved on the surface of liposomes without any change in the liposomal stability. Nearly 2 folds higher cellular uptake was observed post-targeting. T-BEPRO revealed a hydrodynamic diameter of 109.22±0.266 nm. T-BEPRO showed minimal disruption of RBCs ( < 1%). BPRO and EPRO displayed nearly 7-20 folds increase in half-life after encapsulation in the nanoliposomes. For 2D assays, high inhibitory and antimetastatic potential was observed with significantly higher level of apoptosis for T-BEPRO. Substantial reduction was observed in spheroid diameter with higher amount of red fluorescence in treatment groups confirming large number of dead cells compared to control. Remarkably, parenterally delivered T-BEPRO in athymic H1650 tumor bearing mice showed a lowest T/C and tumor-to-body weight ratio with highest %TGI and longest AGD with negligible effect on WBC count as opposed to individual drugs.
Conclusion: The past two decades have witnessed the origin and boom of target protein degraders. This study entails a great promise of PROTAC combinations serving as an effective intervention therapy for patients with NSCLC. Our research successfully illustrated the beneficial effect of combining BRD4 and EGFR PROTACs to attain considerable cytotoxicity, apoptosis, and overexpressed protein degradation. Delivery using targeted nano formulation facilitated in enhanced tumor uptake and efficacy in vivo with minimal off target complexities thereby overcoming current therapeutic hurdles of anticancer agents. Given the promising preclinical outcomes, T-BEPRO could be a prospective remedy in clinical settings for NSCLC patients with varied genetic mutations.
Acknowledgements:This work was funded by the National Institutes of Health (NIH) grant R15..
 Figure 1 (A) Schematic representation of BPRO and EPRO co-loaded in EGFR-peptide targeted liposomal carrier to target the interplay between EGFR and BRD4 for NSCLC. (B) Combination index values of BPRO and EPRO at 1:1 ratio. (C) Clonogenic assay of BE-PRO combination in H1650 cells. (D) Scratch bridging assay of BE-PRO combination in H1650 cells. (E) Flow cytometric analysis of live, apoptotic and dead cells in EGFR resistant cells. (F) ELISA analysis of EGFR expression post treatment exposure for 24 h. Results are expressed as the concentration of EGFR remaining i.e., in (pg)/mL. Each data represents n=3.
 Figure 2. (A) Preparation of T-BEPRO liposomes using modified hydration method. (B) Images of various optimized liposomal formulation. (C) Qualitative estimation of cellular uptake. Fluorescence microscopy images at 10X and intensity quantification of each GFP image of NSCLC cells after fluorescently tagged NT-BEPRO and T-BEPRO incubation. (D) Quantitative analysis of % peptide binding on liposomal surface at various ratios. (E) Quantitative analysis of the intracellular amount of EPRO and BPRO in H1650 cells. (F) Representative images of spheroid size and growth curve treated with various groups compared to control. (G) Fluorescence images portraying apoptotic profile of spheroids post treatment. Composite images of DAPI (blue), calcein-AM (green) and EthD-1 (red). Each data represents n=3.
 Figure 3. (A) Tumor growth curve of different nanoliposomal treatment groups for 36 days. (B) Effect of different treatment groups on body weight of mice. (C) Size analysis of isolated tumors from each group. (D) Images of treated mice depicting anti-tumor effect of the nano formulations. (E) Average number of WBC in mice after treatment with different groups determined via hematological analysis of blood samples. (F) Weight of the isolated tumors for each treatment group. Each data represents n=5.