
Formulation and Delivery - Biomolecular
Category: Poster Abstract
 photo")
Riddhi S. Vichare, MS (she/her/hers)
Graduate Student
Duquesne University
Pittsburgh, Pennsylvania, United States
Riddhi S. Vichare, MS (she/her/hers)
Graduate Student
Duquesne University
Pittsburgh, Pennsylvania, United States
Jelena M. Janjic, Ph.D. (she/her/hers)
Duquesne University
Pittsburgh, Pennsylvania, United States
lu Liu, MS (he/him/his)
Duquesne University
pittsburgh, Pennsylvania, United States
Ashish Dhayani, Ph.D. (he/him/his)
Duquesne University
Pittsburgh, Pennsylvania, United States
Amit Chandra Das, MS
Duquesne University
Pittsburgh, Pennsylvania, United States
Vijay Gorantla, Ph.D. (he/him/his)
Wake Forest University
newtork, New York, United States
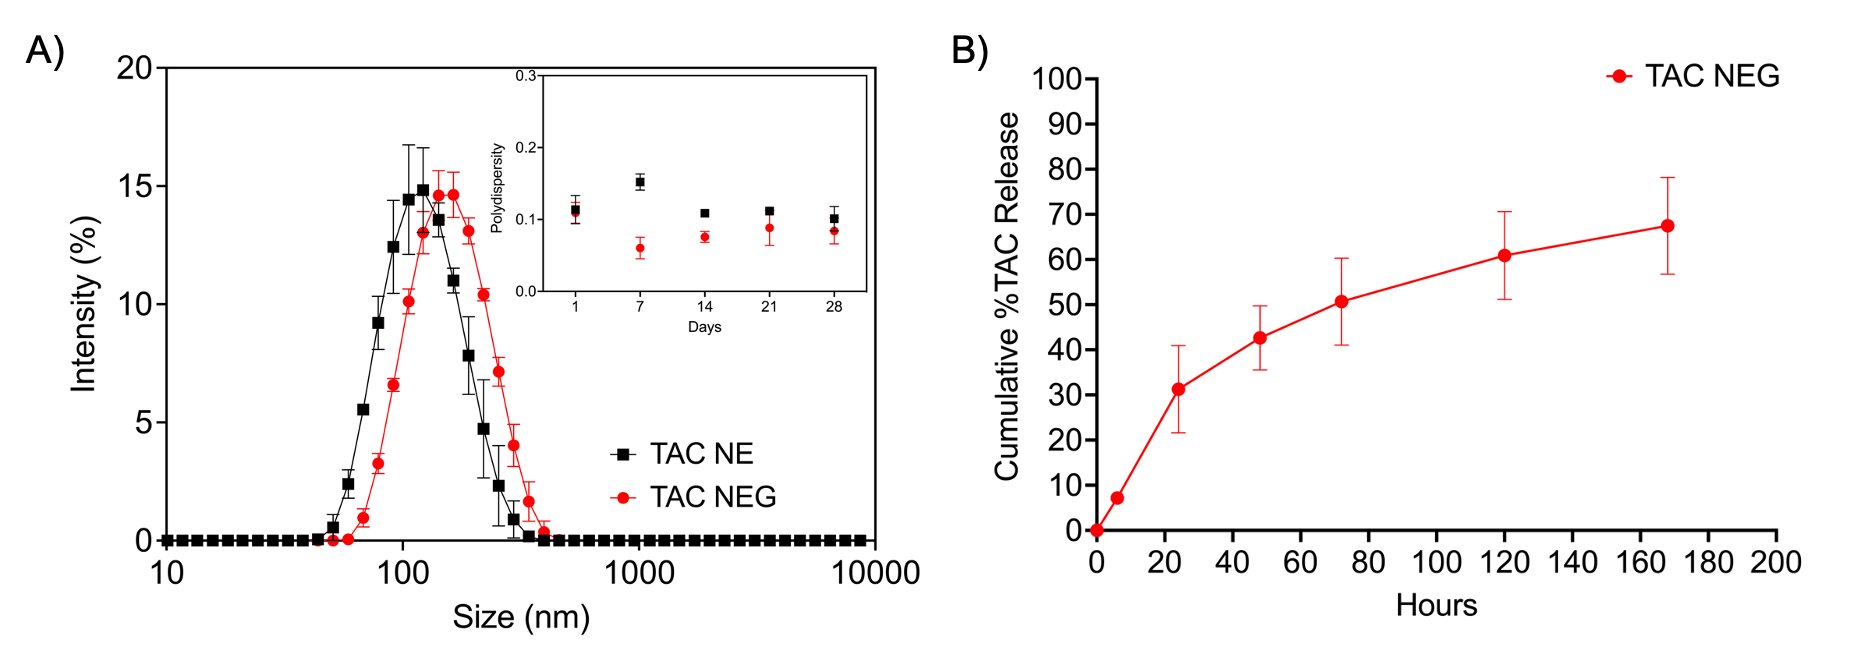 Figure 1. A) Overlay of averaged size distribution by intensity and dispersity index of Tacrolimus loaded NE and NEG. B) In vitro release profile of TAC from TAC-NEG using dialysis bag in PBS (pH=7.4) at 37℃ (n=3).
 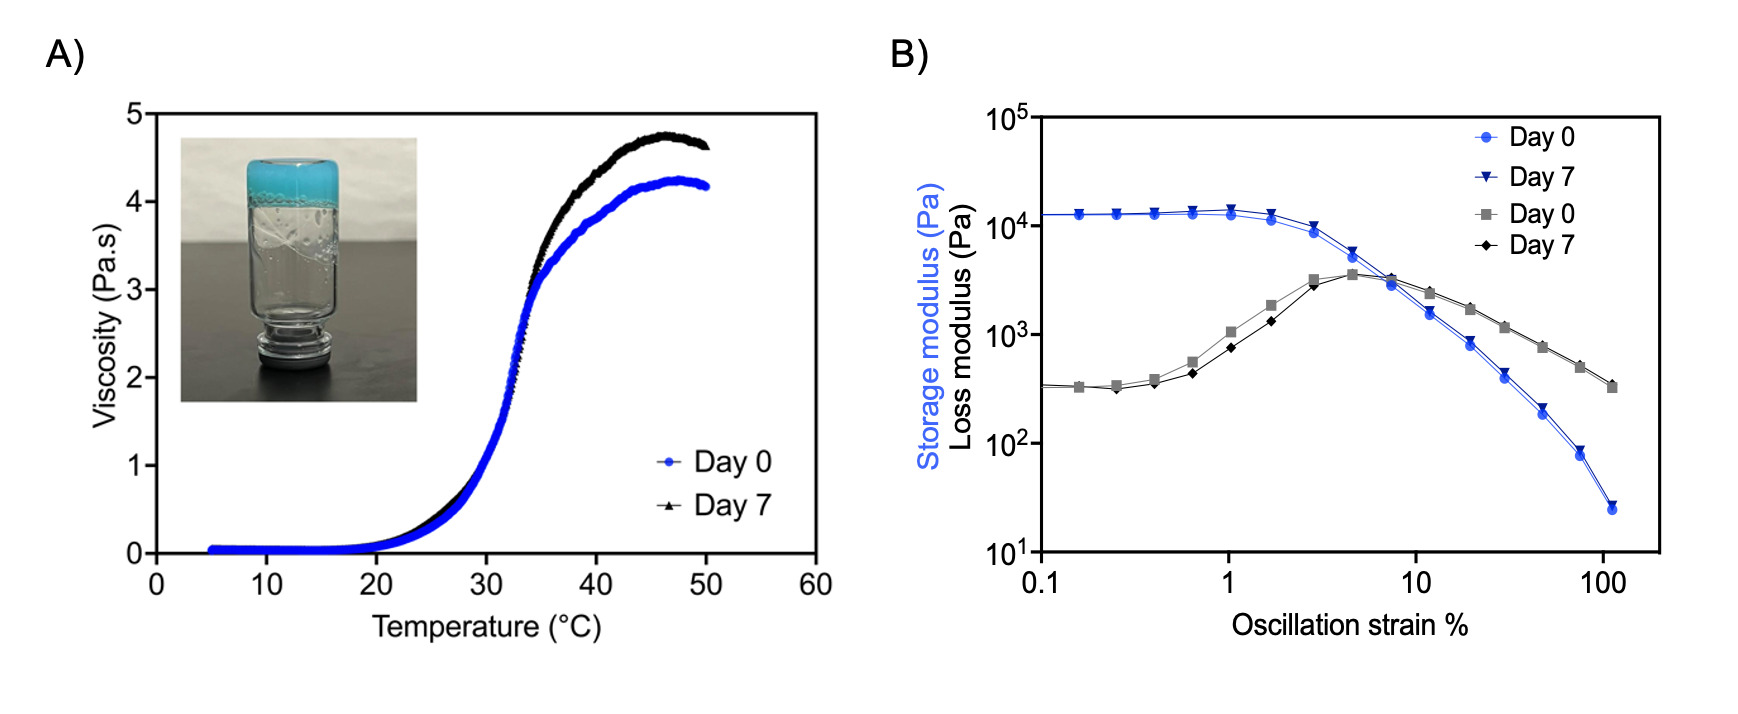 Figure 2. A) Effect of temperature (℃) on the viscosity (Pa.s) of TAC-NEG and a photograph of TAC- NEG exposed to 37℃ for 5 minutes. B) Relationship of storage and loss modulus with oscillation amplitude. The data shows that the gel strength does not vary with time (Day 0 and Day 7), demonstrating stable gel formation.
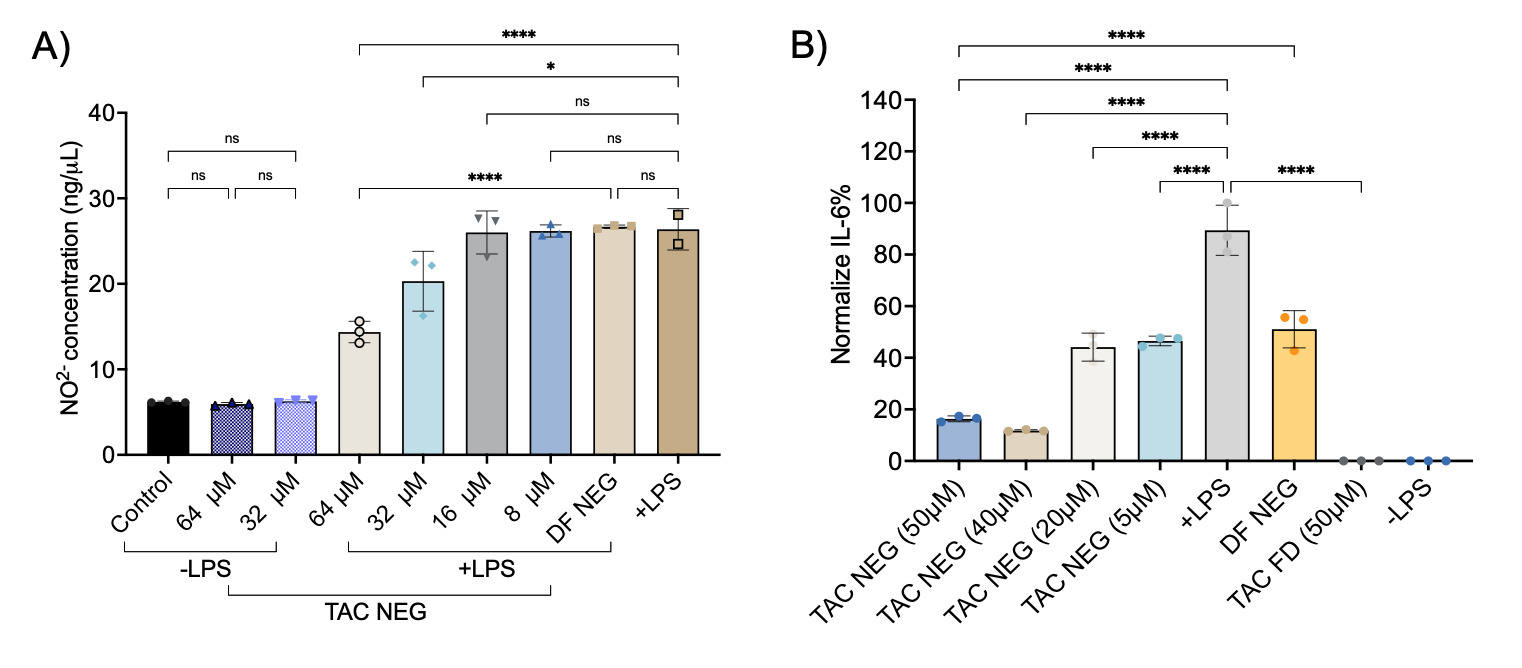 Figure 3. A) Comparison of release of nitric oxide (NO2-) from macrophages exposed to TAC-NEG (64 μM -8 μM) and volume-matched to highest concentration drug free nanoemulgel (DF-NEG) in presence or absence of LPS. B) Comparison of Interleukin-6 (IL-6) inhibition from LPS-activated macrophages exposed to TAC-NEG (50 μM -5 μM), volume-matched to highest concentration DF-NEG, and TAC free drug (50 μM). Each bar represents mean ± SD (n=3, independent culture). ns not significant, ***p < 0.0005, ****p < 0.00005.