
Manufacturing and Analytical Characterization - Chemical
Category: Poster Abstract
 photo")
Yang Yang, PhD (she/her/hers)
Research Staff Fellow
US Food and Drug Administration
Silver Spring, Maryland, United States
Apipa Wanasathop, Ph.D. (she/her/hers)
US Food and Drug Administration
Silver Spring, Maryland, United States
Kartik Roy, Ph.D. (he/him/his)
US Food and Drug Administration
Silver Spring, Maryland, United States
Ann-marie Afrifa, Ph.D. (she/her/hers)
US Food and Drug Administration
Silver Spring, Maryland, United States
Jiang Wang, Ph.D. (he/him/his)
US Food and Drug Administration
Silver Spring, Maryland, United States
Sergio Coelho, Ph.D. (he/him/his)
US Food and Drug Administration
Silver Spring, Maryland, United States
Steven Adah, Ph.D. (he/him/his)
US Food and Drug Administration
SILVER SPRING, Maryland, United States
Patrick Faustino, Ph.D. (he/him/his)
US Food and Drug Administration
Silver Spring, Maryland, United States
Muhammad Ashraf, Ph.D.
US Food and Drug Administration
Silver Spring, Maryland, United States
Xiaoming Xu, Ph.D.
US Food and Drug Administration
Silver Spring, Maryland, United States
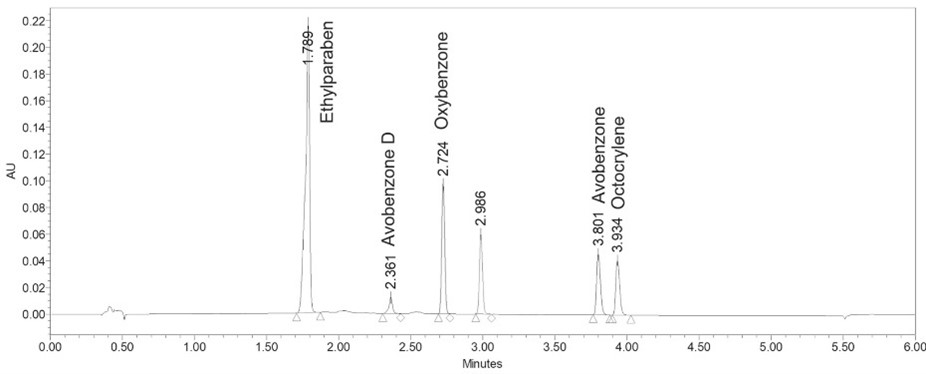 Figure 1. UPLC Chromatograms of chemical UV filters and its impurity (avobenzone D).
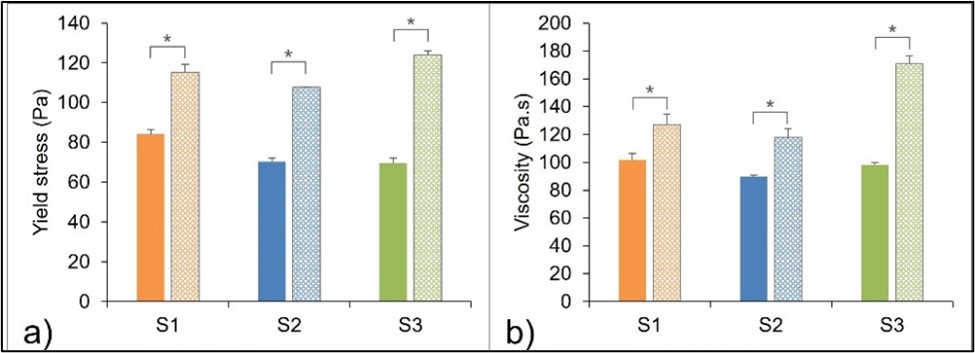 Figure 2. Comparison of (a) yield stress and (b) viscosity at medium shear rate (1 s-1) between time 0 (solid) and after one year storage (dotted), mean ± SD, n = 3, paired t-test (*p < 0.05).
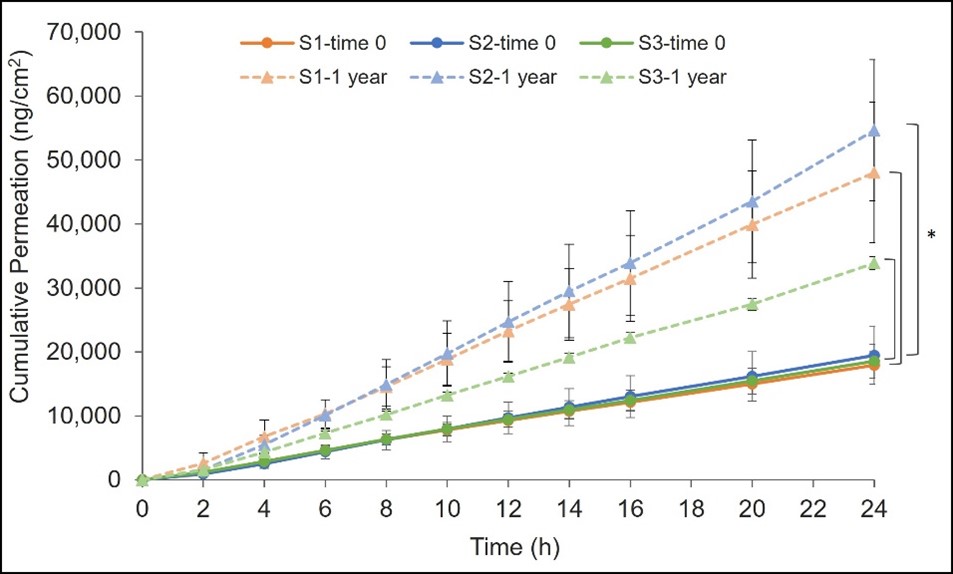 Figure 3. Cumulative permeation of oxybenzone after dose normalizing from time 0 (solid) and after one year of storage (dotted). S1, S2, and S3 representing in orange, blue, and green, respectively. Data expressed as mean (ng/cm2) ± SD, n=3-6, ANOVA (*p < 0.05).