
Manufacturing and Analytical Characterization - Biomolecular
Category: Poster Abstract
 photo")
Mariana Biscaia, MS (she/her/hers)
PhD Student
University Coimbra/Bluepharma
Coimbra, Coimbra, Portugal
Mariana Biscaia, MS (she/her/hers)
PhD Student
University Coimbra/Bluepharma
Coimbra, Coimbra, Portugal
Ana Sofia Lourenço, Ph.D. (she/her/hers)
Bluepharma
Coimbra, Coimbra, Portugal
Antonio Nunes, Pharm.D., Ph.D. (he/him/his)
Bluepharma
Coimbra, Coimbra, Portugal
Joao Nuno Moreira, Pharm.D., Ph.D. (he/him/his)
University Coimbra
Coimbra, Coimbra, Portugal
Sérgio Simões, Pharm.D., Ph.D. (he/him/his)
Bluepharma
Coimbra, Coimbra, Portugal
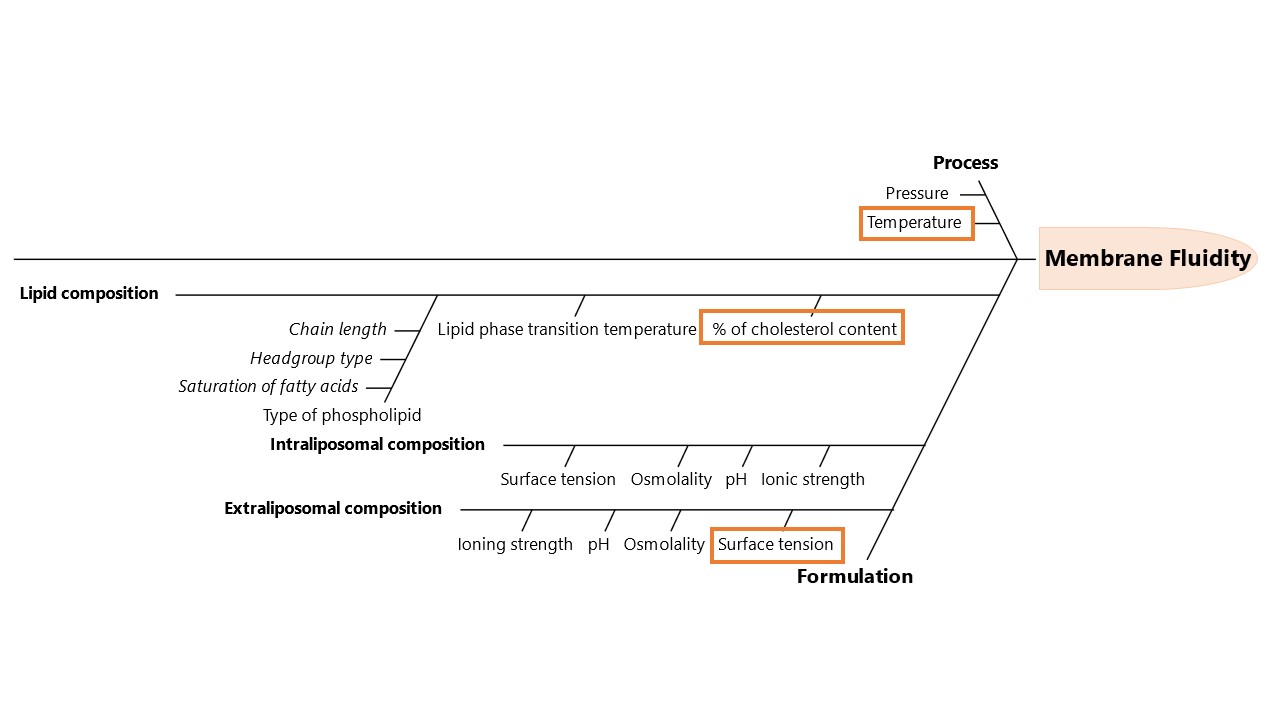 Figure 1: An Ishikawa diagram illustrating process and formulation factors that may have an impact on the liposome’s membrane fluidity.
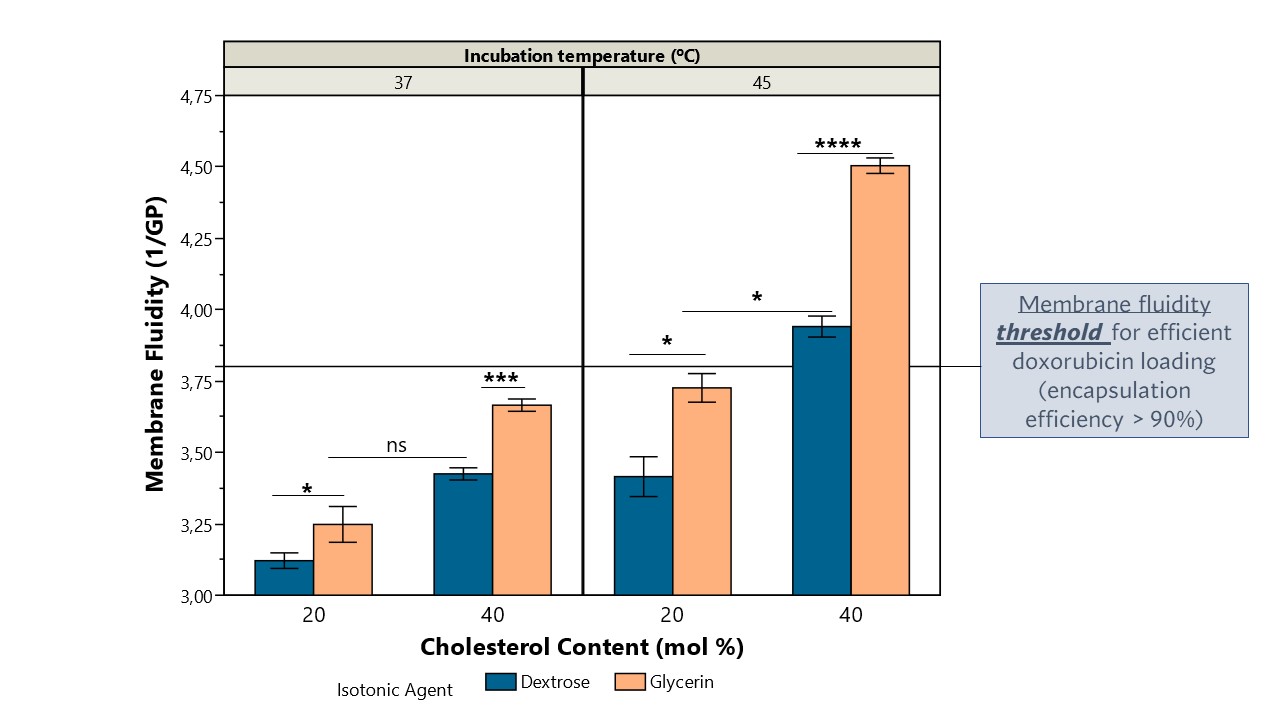 Figure 2: Liposome’s membrane fluidity as a function of cholesterol content (mol%), isotonic agent (dextrose vs glycerin) and incubation temperatures (37 vs 45ºC). Membrane fluidity was determined using the equation: [1/GP], in which GP is the generalized polarization ([(Em440-Em490)/(Em440+Em490)]). Data represent the mean ± SD; the p-value was calculated using Tukey's multiple comparisons test, ****p < 0.001, ***p < 0.001, *p < 0.05, nsp >0.05, n=3.
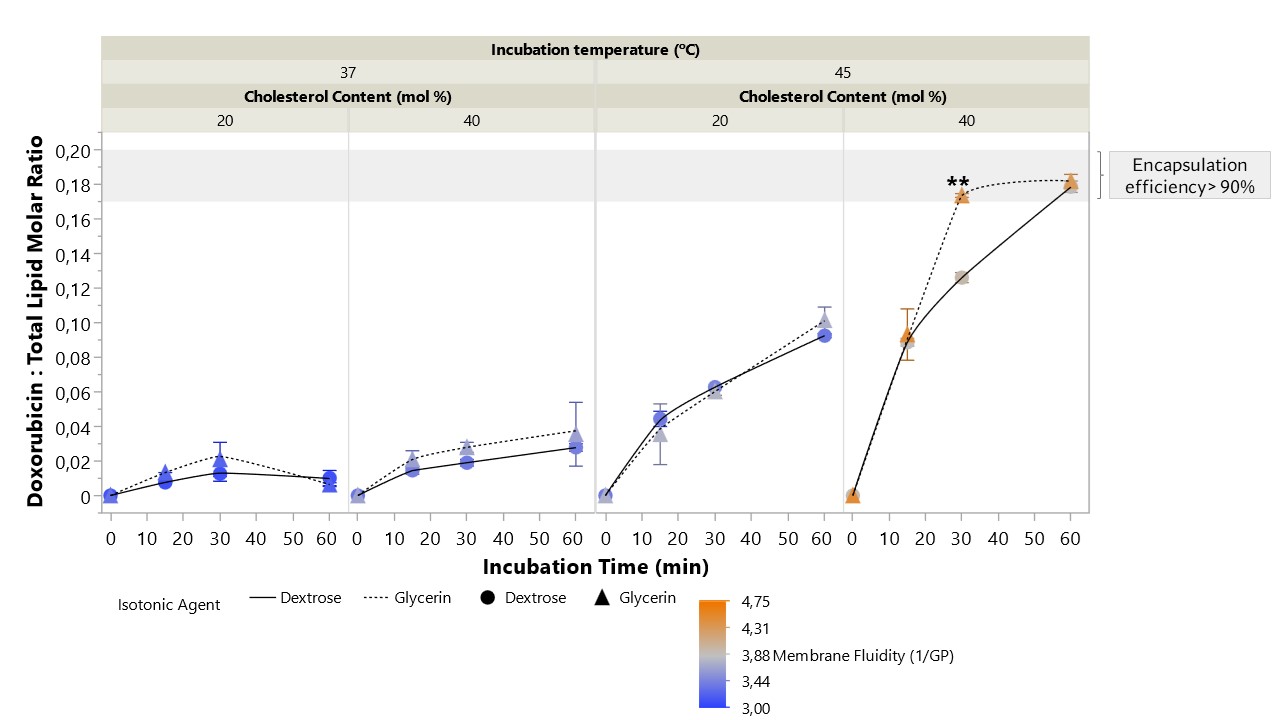 Figure 3: Time course of doxorubicin uptake in DSPC/CHOL/DSPE-PEG liposomes with different % of cholesterol (20 vs 40 mol%) at different temperatures (37 and 45ºC) and using isotonic agents with different surface tension (dextrose – circles and solid line; glycerin- triangles and dashed line). Liposomes were incubated with doxorubicin at a drug:total lipid molar ratio of 0.19:1. The color gradient represents the membrane fluidity of each formulation at the respective incubation temperature. Data represent the mean ± SD; the p-value was calculated using Tukey's multiple comparisons test, **p < 0.01, n=3.