
Formulation and Delivery - Chemical
Category: Poster Abstract
 photo")
Na Li, Ph.D. (she/her/hers)
Assistant Professor
University of Connecticut
Storrs, Connecticut, United States
Na Li, Ph.D. (she/her/hers)
Assistant Professor
University of Connecticut
Storrs, Connecticut, United States
Rayan Sabra, Ph.D. (she/her/hers)
University of Connecticut
Storrs, Connecticut, United States
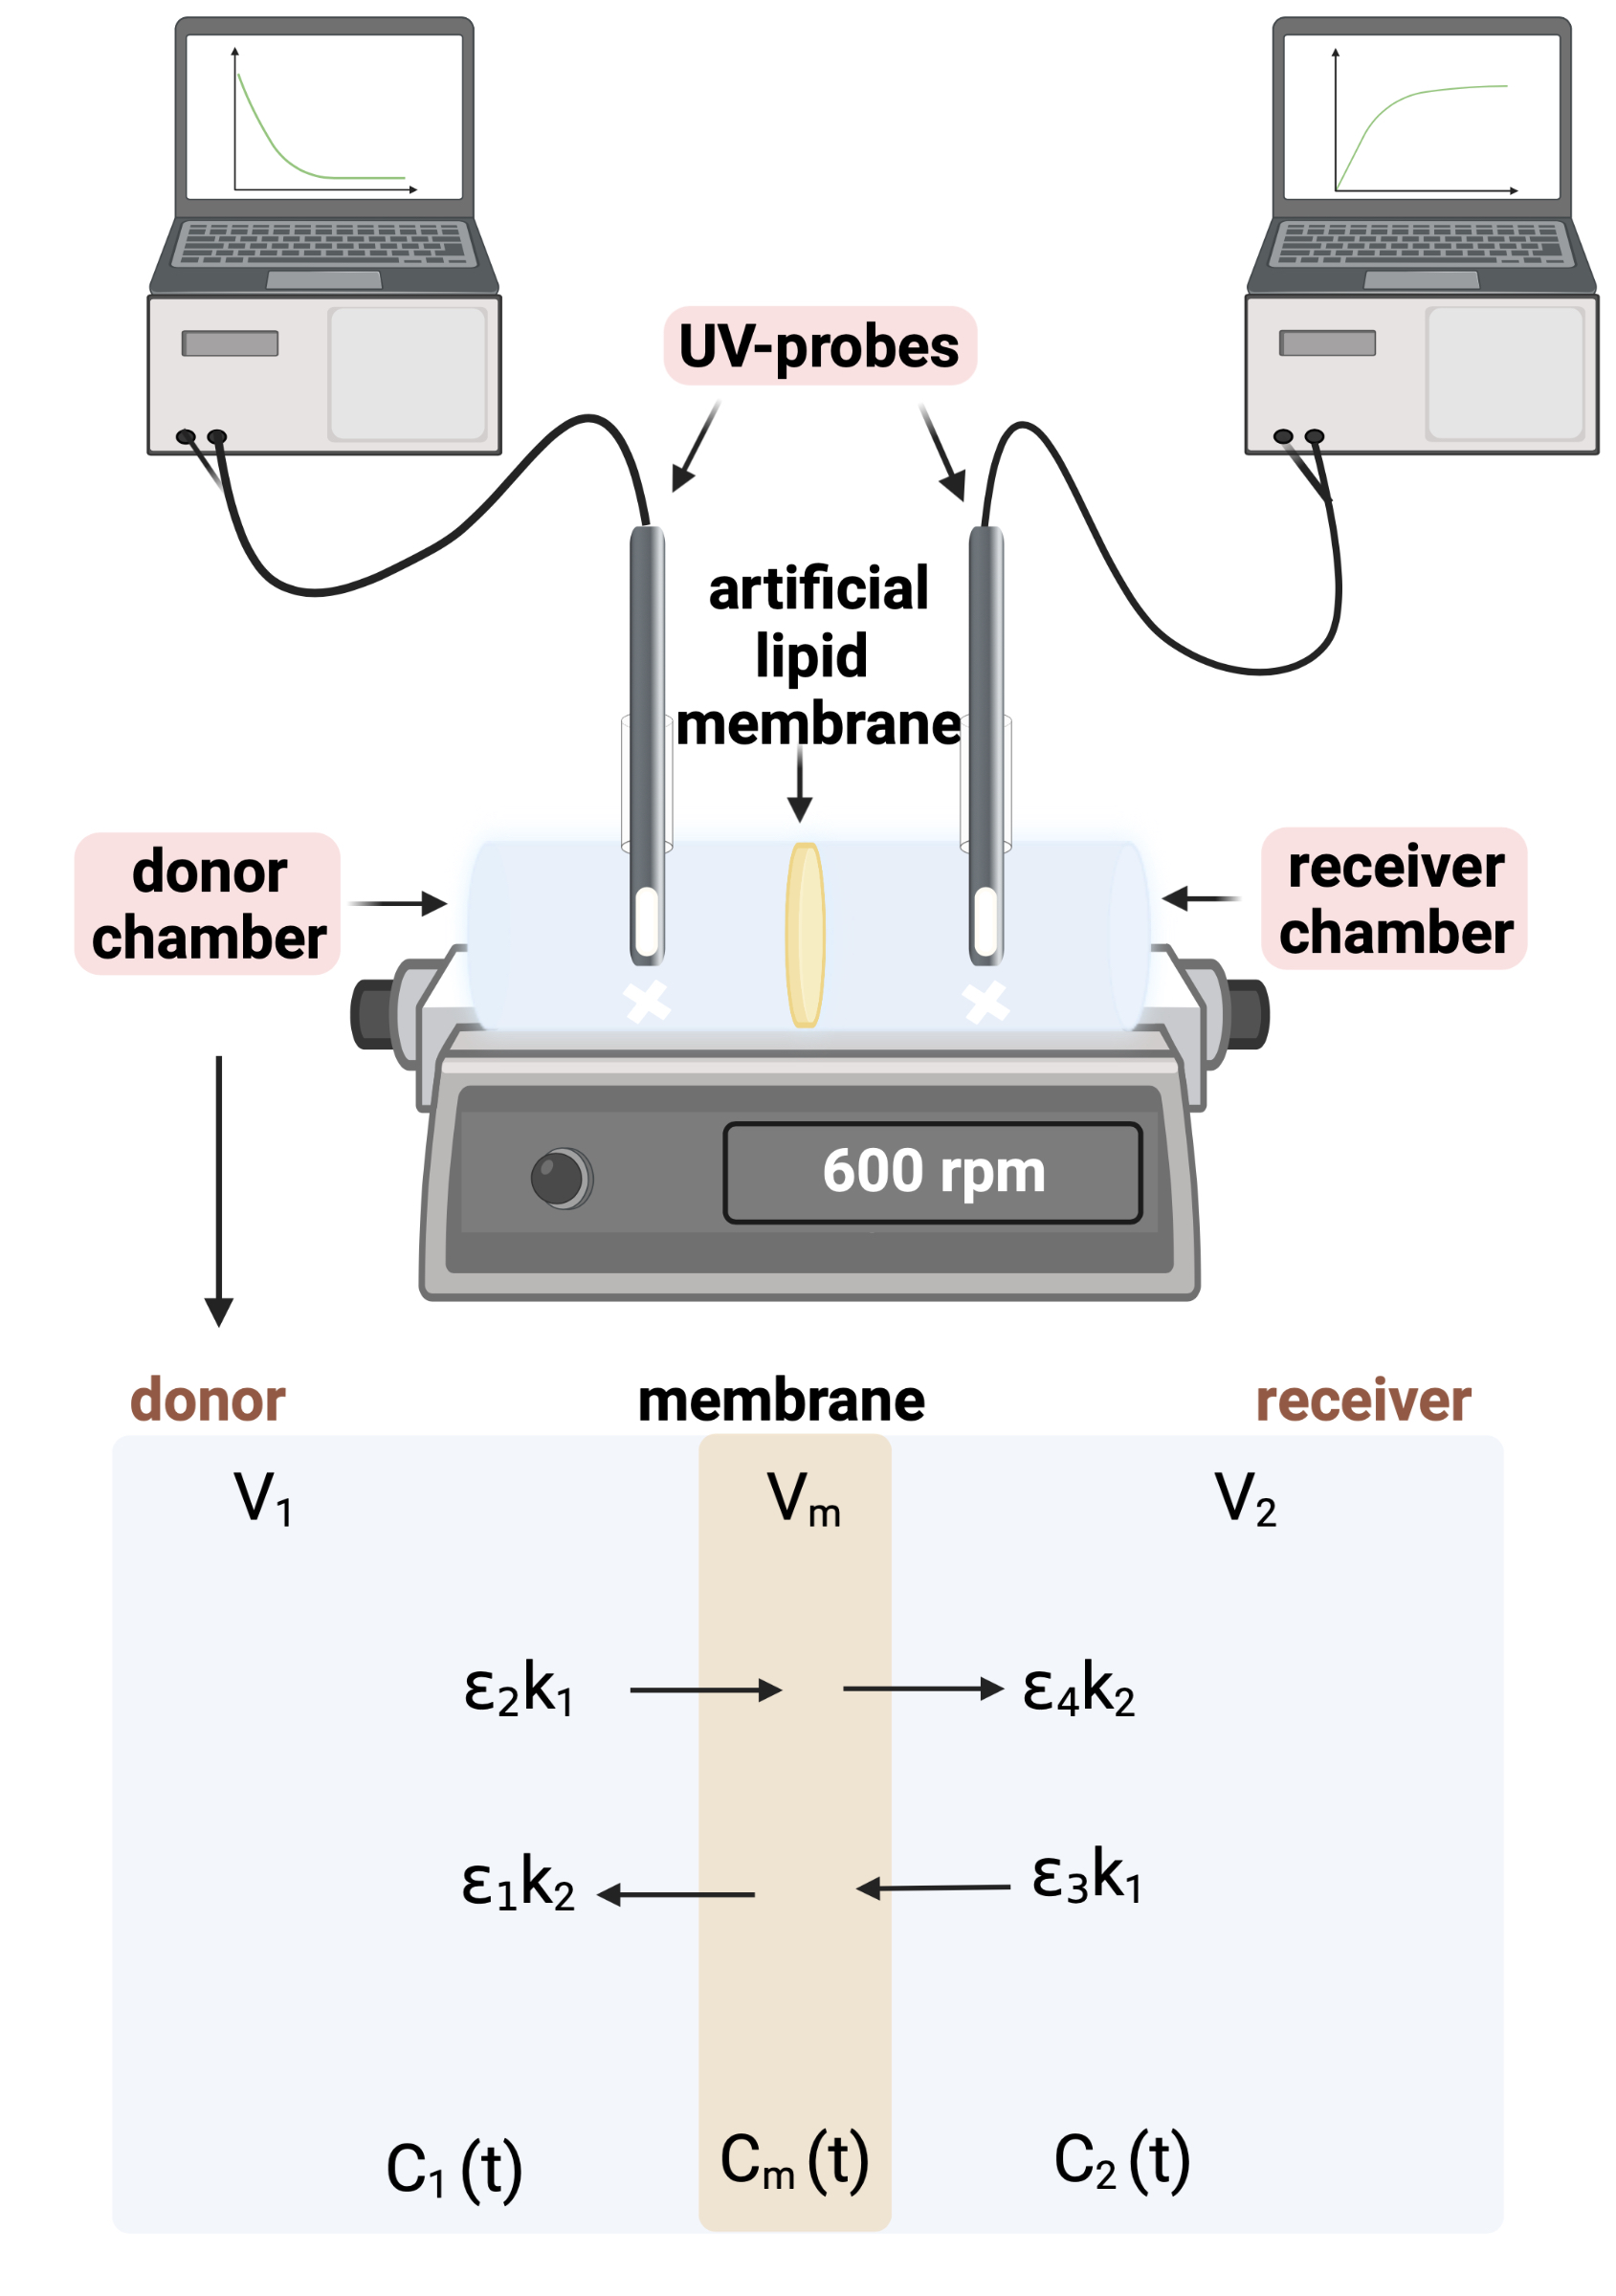 Figure 1. Schematic illustration of the side-by-side setup used, where V_1, V_2, and V_m represent the volume of solution present in the donor receiver, and membrane, respectively, while C_1, C_2, and C_m represent the donor, receiver, and membrane solution concentration at time t, whilst ε_2 k_1, ε_3 k_1, ε_1 k_2, and ε_4 k_2 are the overall mass transport rate constants describing solute transfer from donor and receiver bulk solutions to the membrane and from the membrane to bulk solutions.
 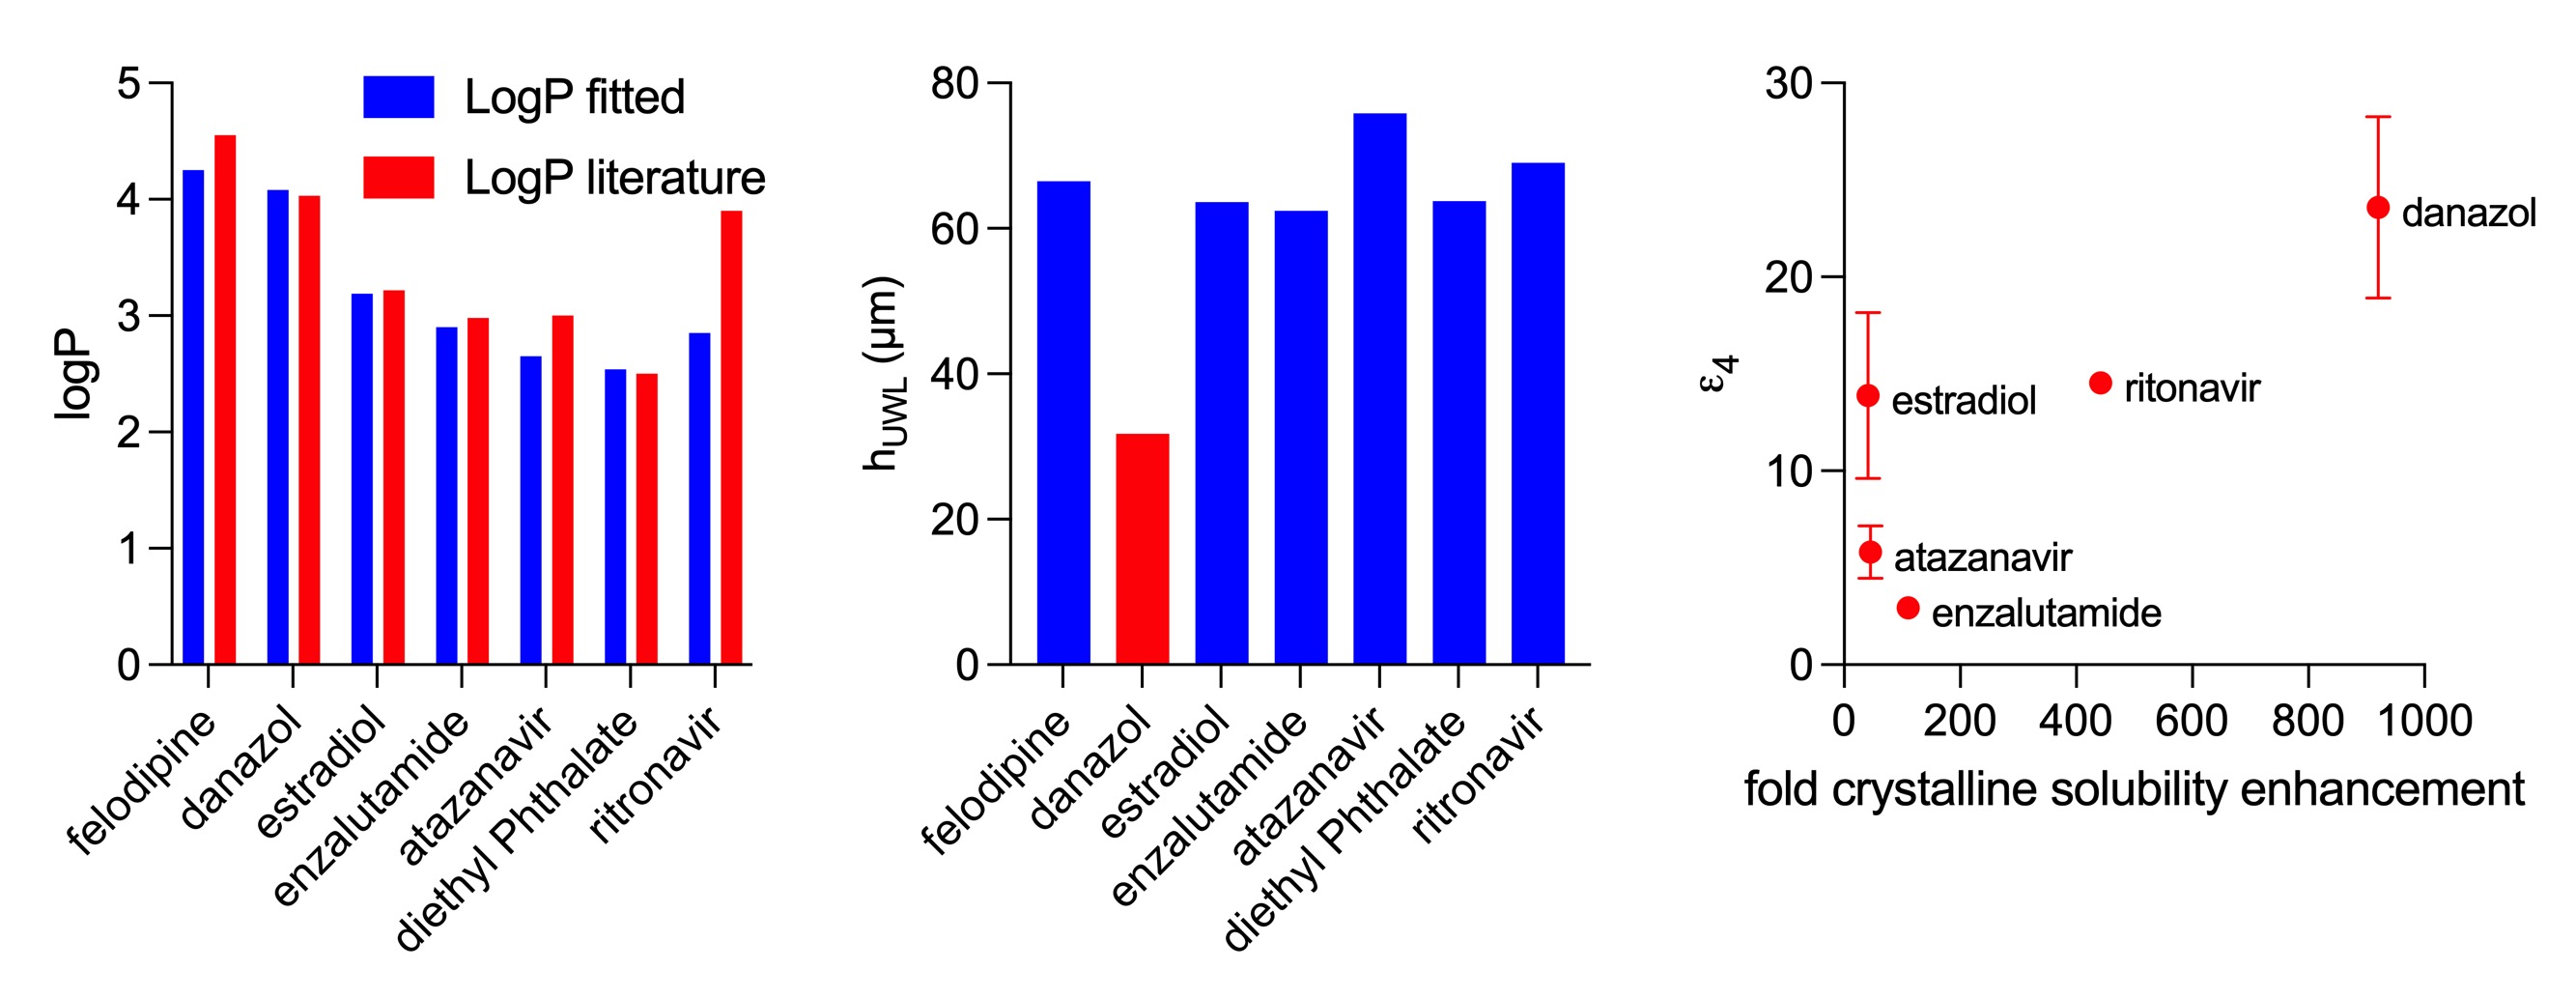 Figure 2. Fitted logP, effective UWL thickness, and ε_4 values for different model drugs
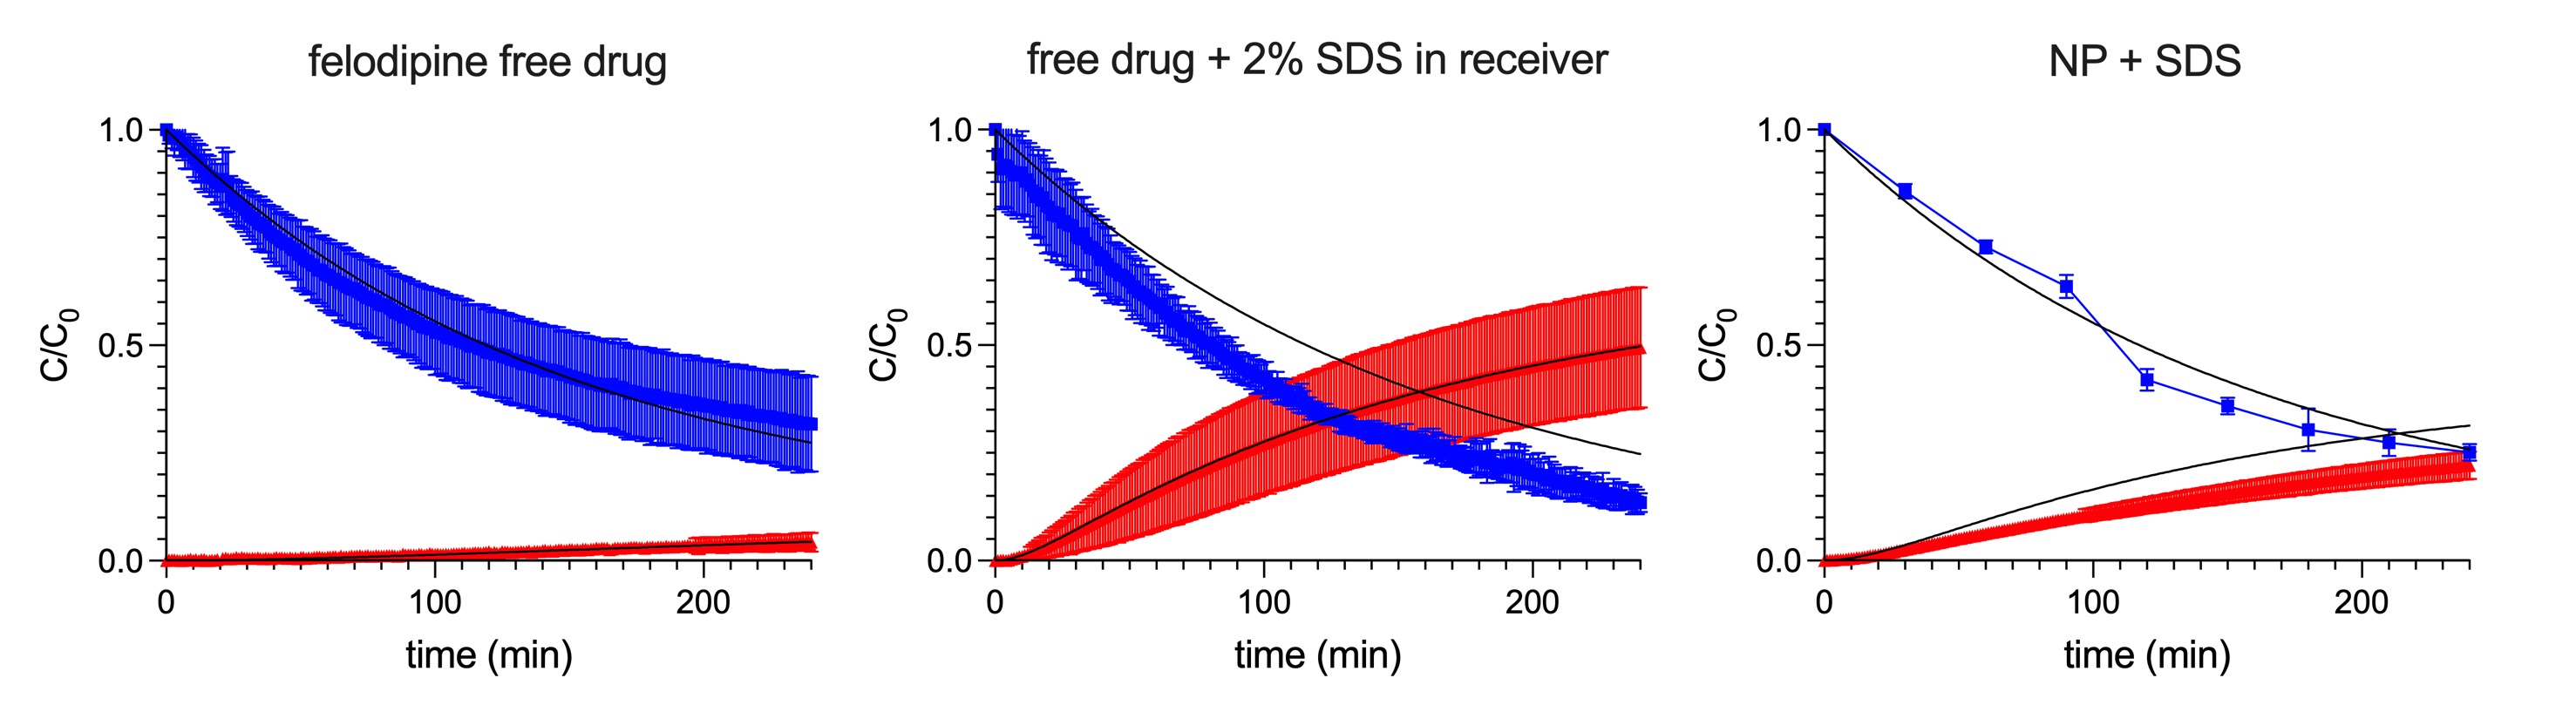 Figure 3. Representative fittings results showing agreements with experimental data