
Formulation and Delivery - Chemical
Category: Poster Abstract
Bivek Chaulagain, MS
North Dakota State University
Fargo, North Dakota, United States
Bivek Chaulagain, MS
North Dakota State University
Fargo, North Dakota, United States
Jagdish Singh, Ph.D. (he/him/his)
North Dakota State University
Fargo, North Dakota, United States
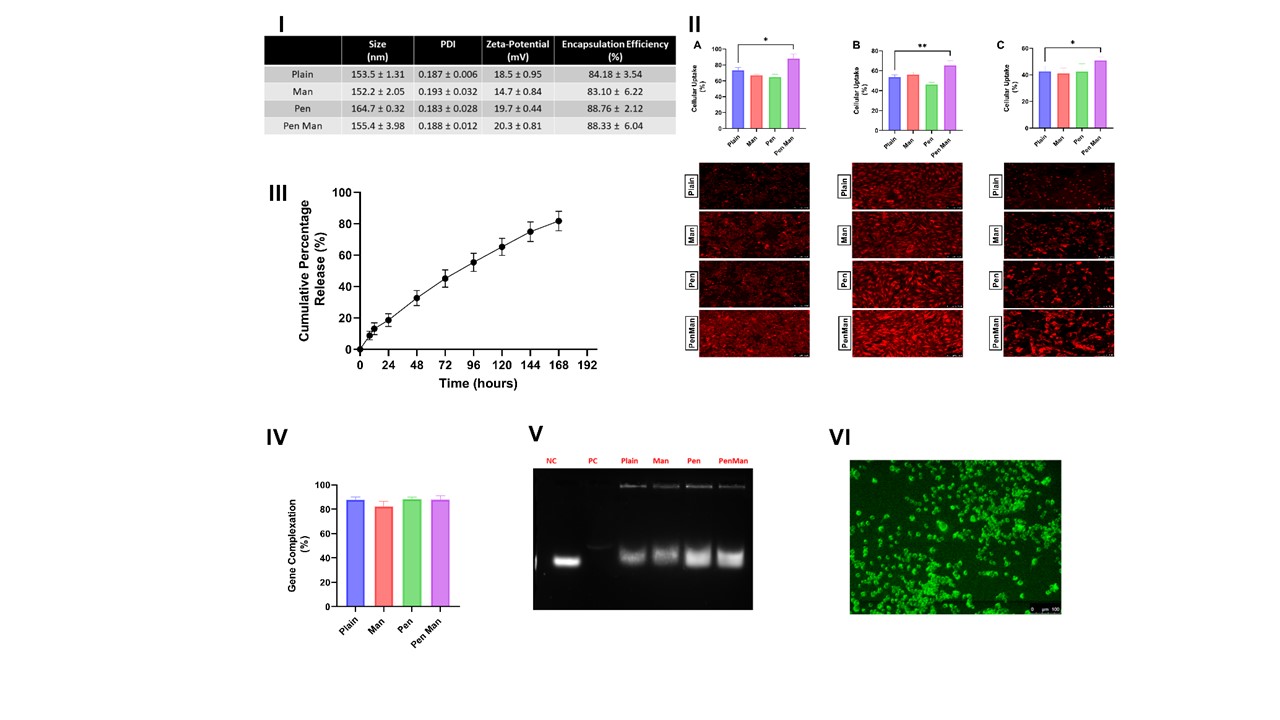 Figure 1: Physiochemical characterization of cannabidiol liposomes for their ability to load cannabidiol and plasmid DNA I) Size, PDI, zeta-potential and encapsulation efficiency of plain and functionalized cannabidiol liposomes II) Quantitative and qualitative cellular uptake of cannabidiol liposomes in A) IMG cell B) b.END cell C) Primary astrocytes III) Cumulative percentage drug release of cannabidiol liposomes for one week IV) Gene complexation of plain and functionalized cannabidiol liposomes estimated using Hoechst 33342 dye V) Agarose gel electrophoresis demonstrating DNase protection assay of plain and functionalized cannabidiol liposomes VI) GFP expression in IMG cell 48 hours after transfection with cannabidiol liposomes. The data represents mean ± SD (n=4) (* p < 0.05)
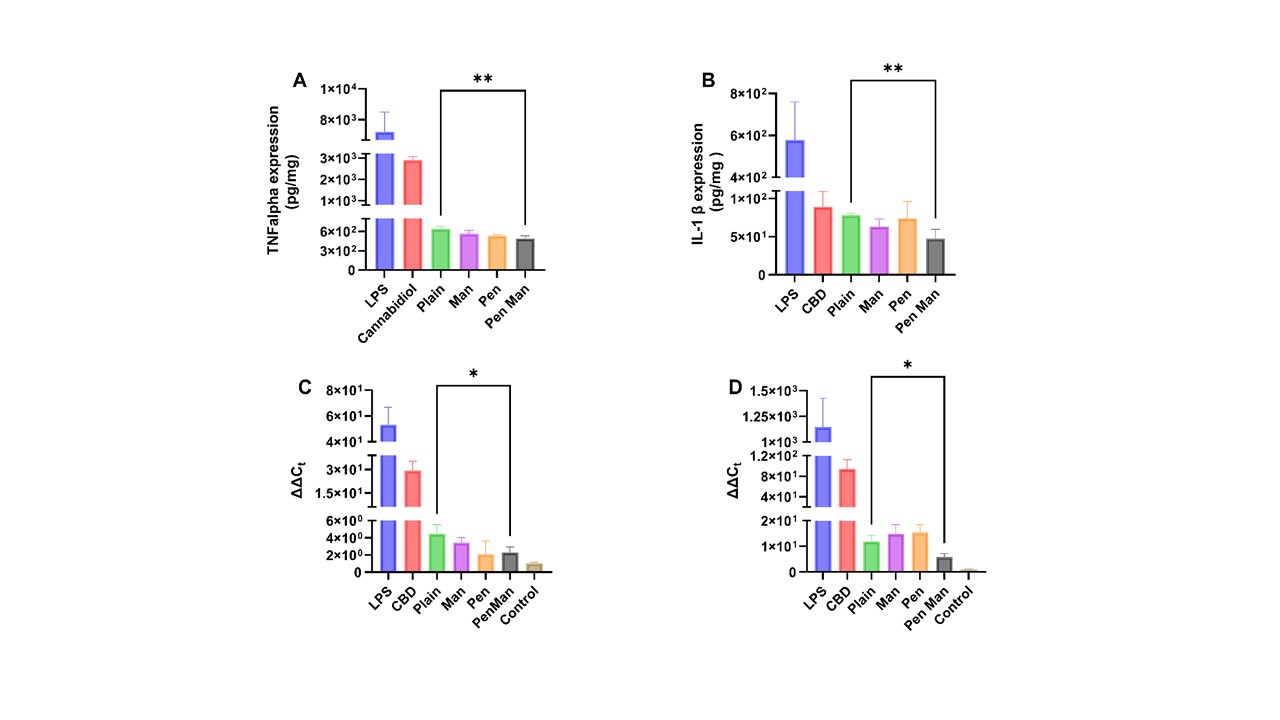 Figure 2: Anti-inflammatory property of cannabidiol liposomes in Immortalized Microglia (IMG) cell line stimulated by 10 ng/ml LPS for 24 hours. The treatment consists of free cannabidiol or cannabidiol liposomes equivalent to 10μM of cannabidiol A) Protein expression of TNF-α estimated using ELISA kits B) Protein expression of IL-1 β estimated using ELISA Kits C) Relative gene expression of TNF-α estimated using qPCR. D) Relative gene expression of IL-1β estimated using qPCR. The data represents mean ± SD (n=4) (* p < 0.05)
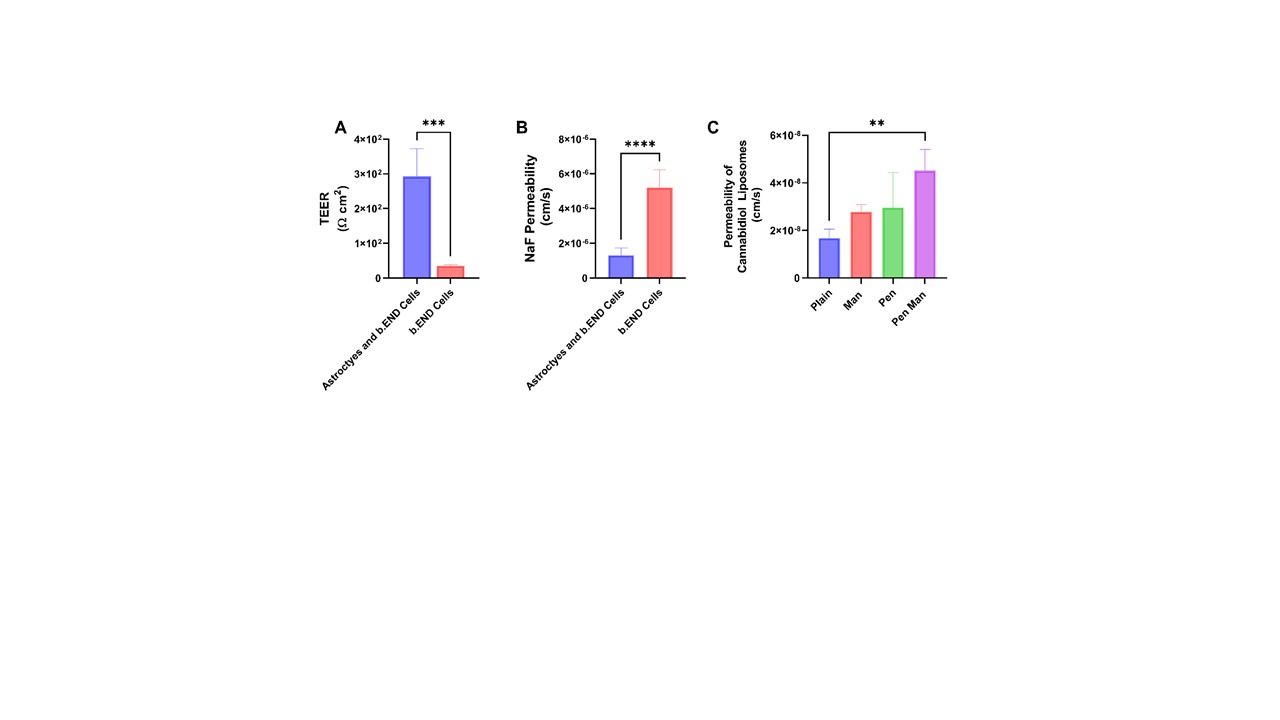 Figure 3: Integrity of in vitro BBB co-culture model and transport of cannabidiol liposomes across the barrier a) TEER of BBB as measured by Epithelial Voltohmeter (EVOM) b) Integrity of BBB as measured by Sodium Fluorescein permeability across the co-culture barrier C) Transport of cannabidiol liposomes across the barrier. The data represents mean ± SD (n=4) (* p < 0.05)