
Bioanalytics - Chemical
Category: Poster Abstract
Richa Vartak, Ph.D.
Graduate Student
St. John's University
Queens, New York, United States
Richa Vartak, Ph.D.
Graduate Student
St. John's University
Queens, New York, United States
Bhavesh Deore, MS (he/him/his)
St. John's University
Queens, New York, United States
Carlos A. Sanhueza Chavez, Ph.D.
St. John's University
Jamiaca, New York, United States
Ketan Patel, Ph.D.
St. John's University
Jamaica, New York, United States
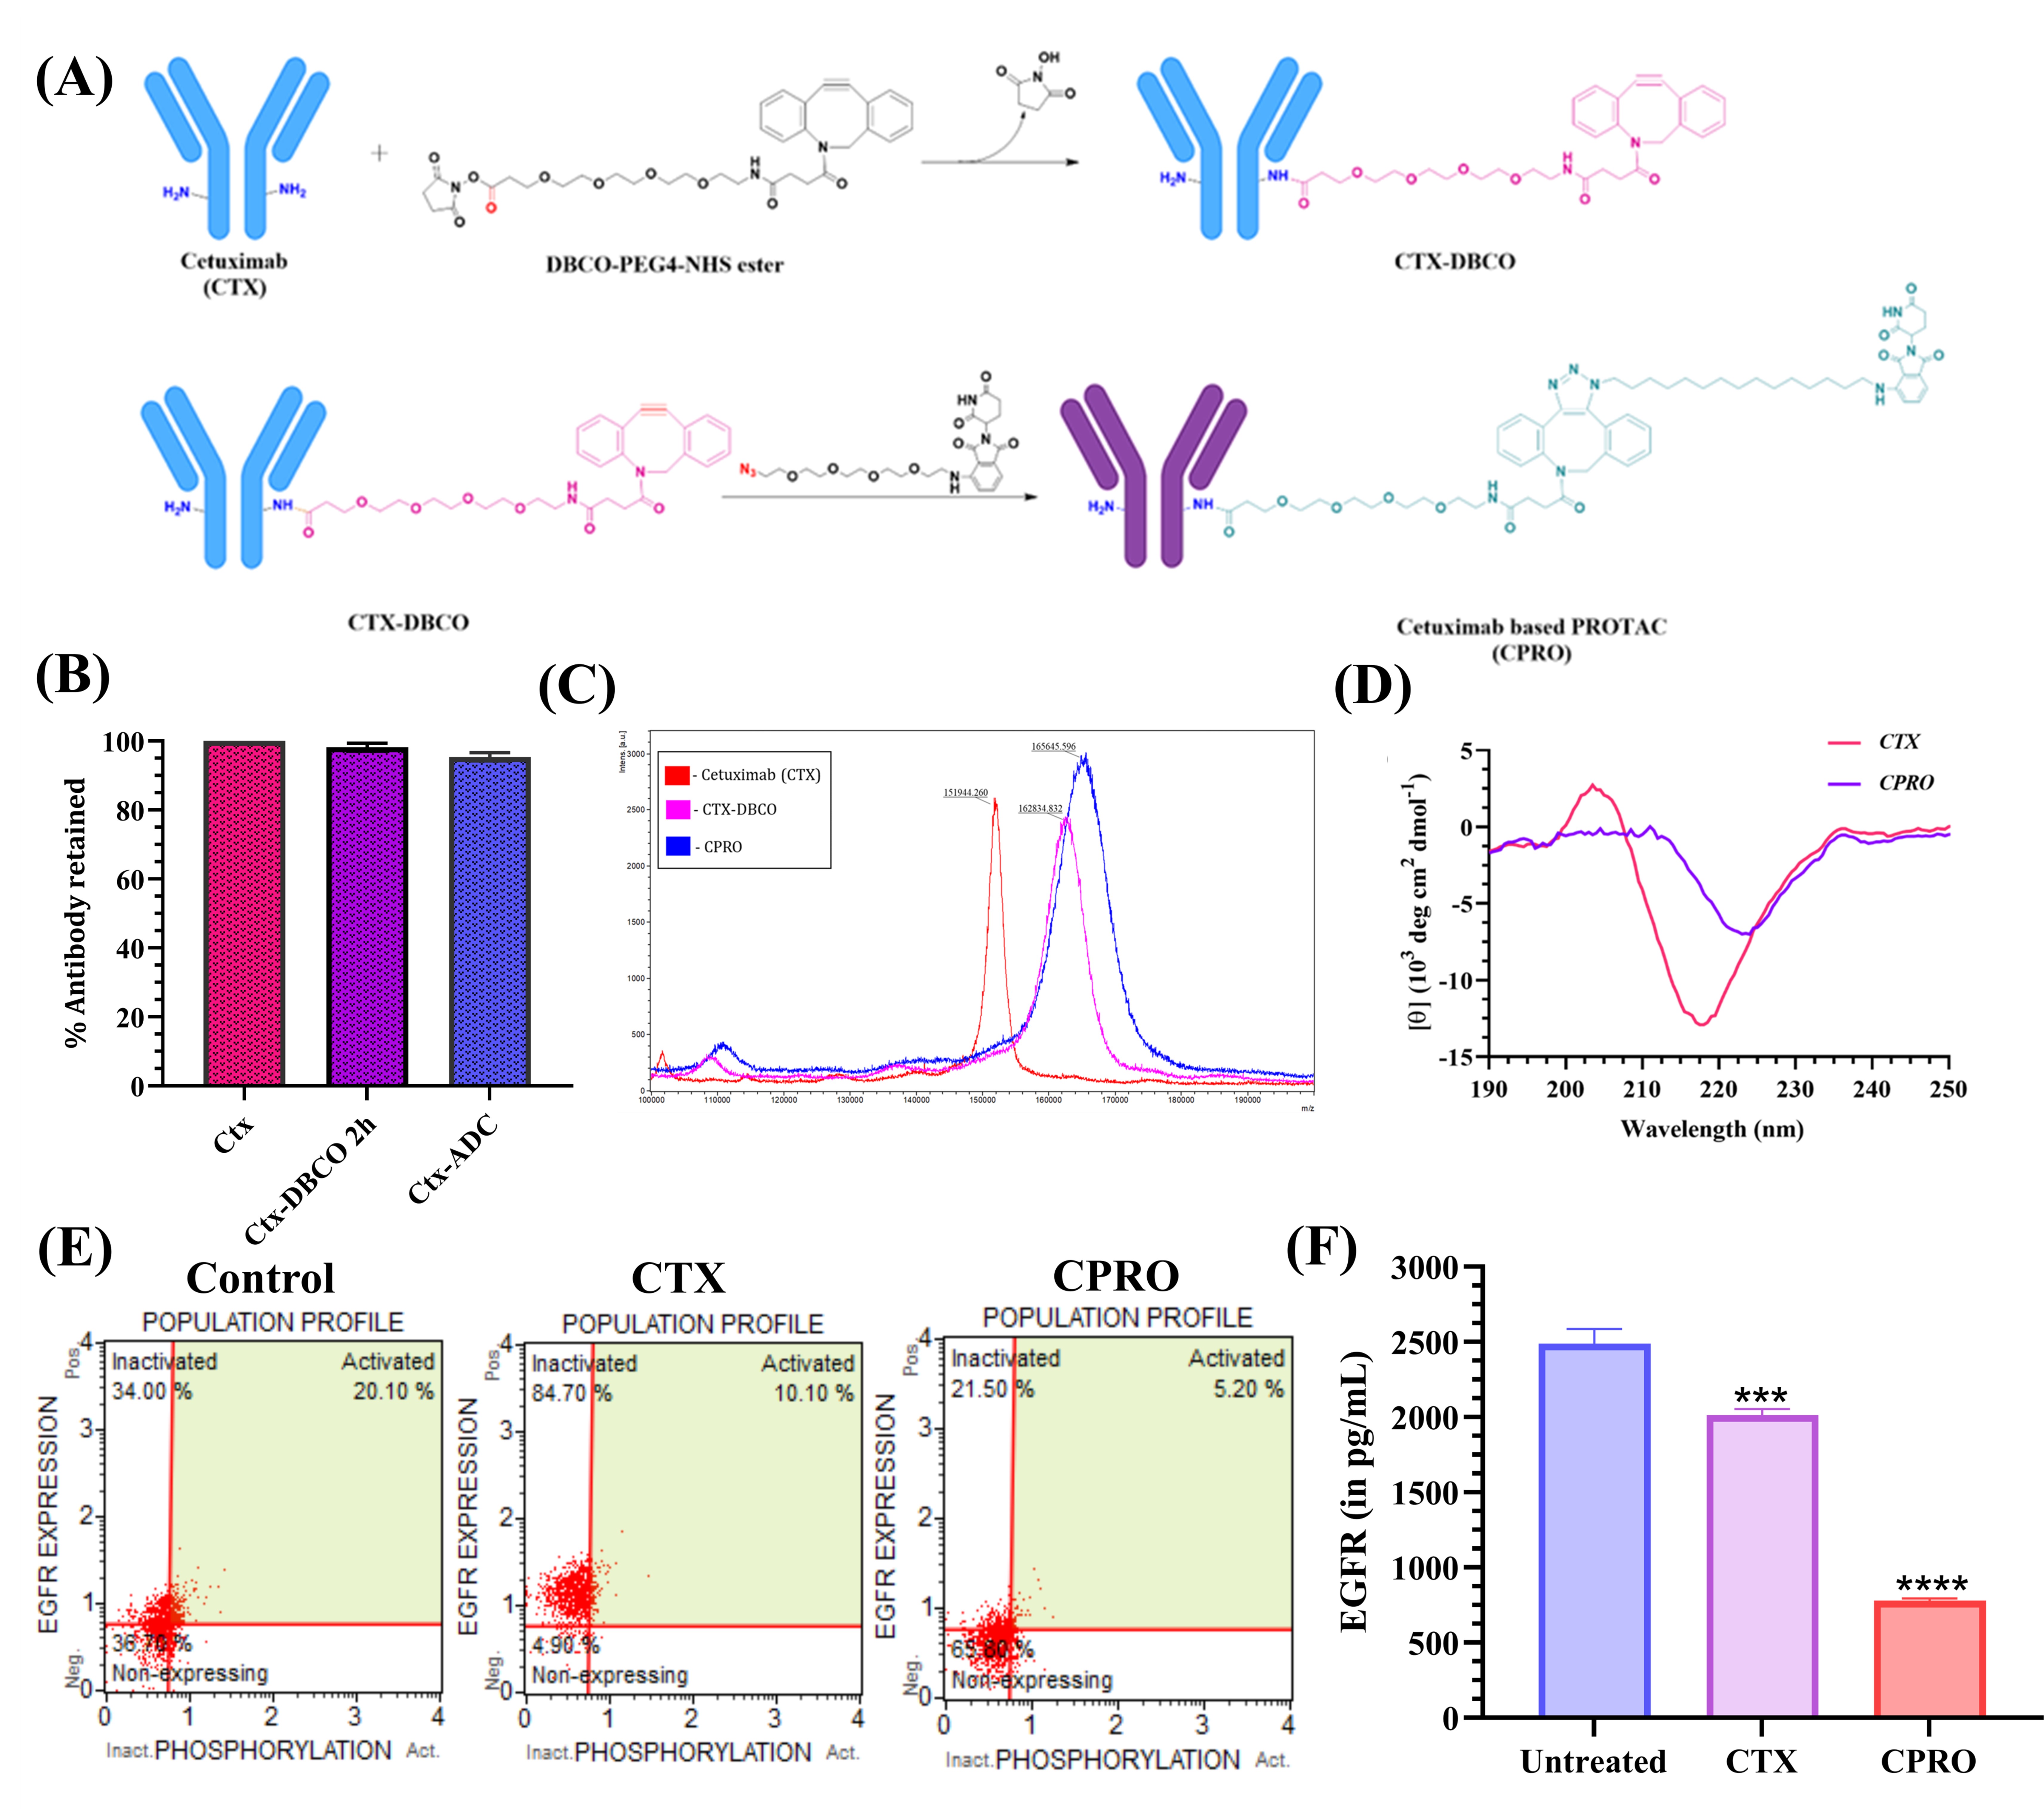 Figure 1. (A) Synthetic scheme of cetuximab-based PROTAC (CPRO) synthesis. (B) Protein recovery during synthesis of CTX, CTX-DBCO and CPRO post ultracentrifugation. (C) MADLI -TOF/TOF intact mass spectrum of CTX, CTX-DBCO and CPRO. (D) Far-UV CD spectra of CTX and final conjugate, CPRO post lysine-based conjugation. (E) EGFR expression profile demonstrating inactivated, activated, and non-expressing EGFR cells post 4h treatment incubation in H1650 cells. (F) Assessment of EGFR downregulation using EGFR ELISA. Each data represents n=3.
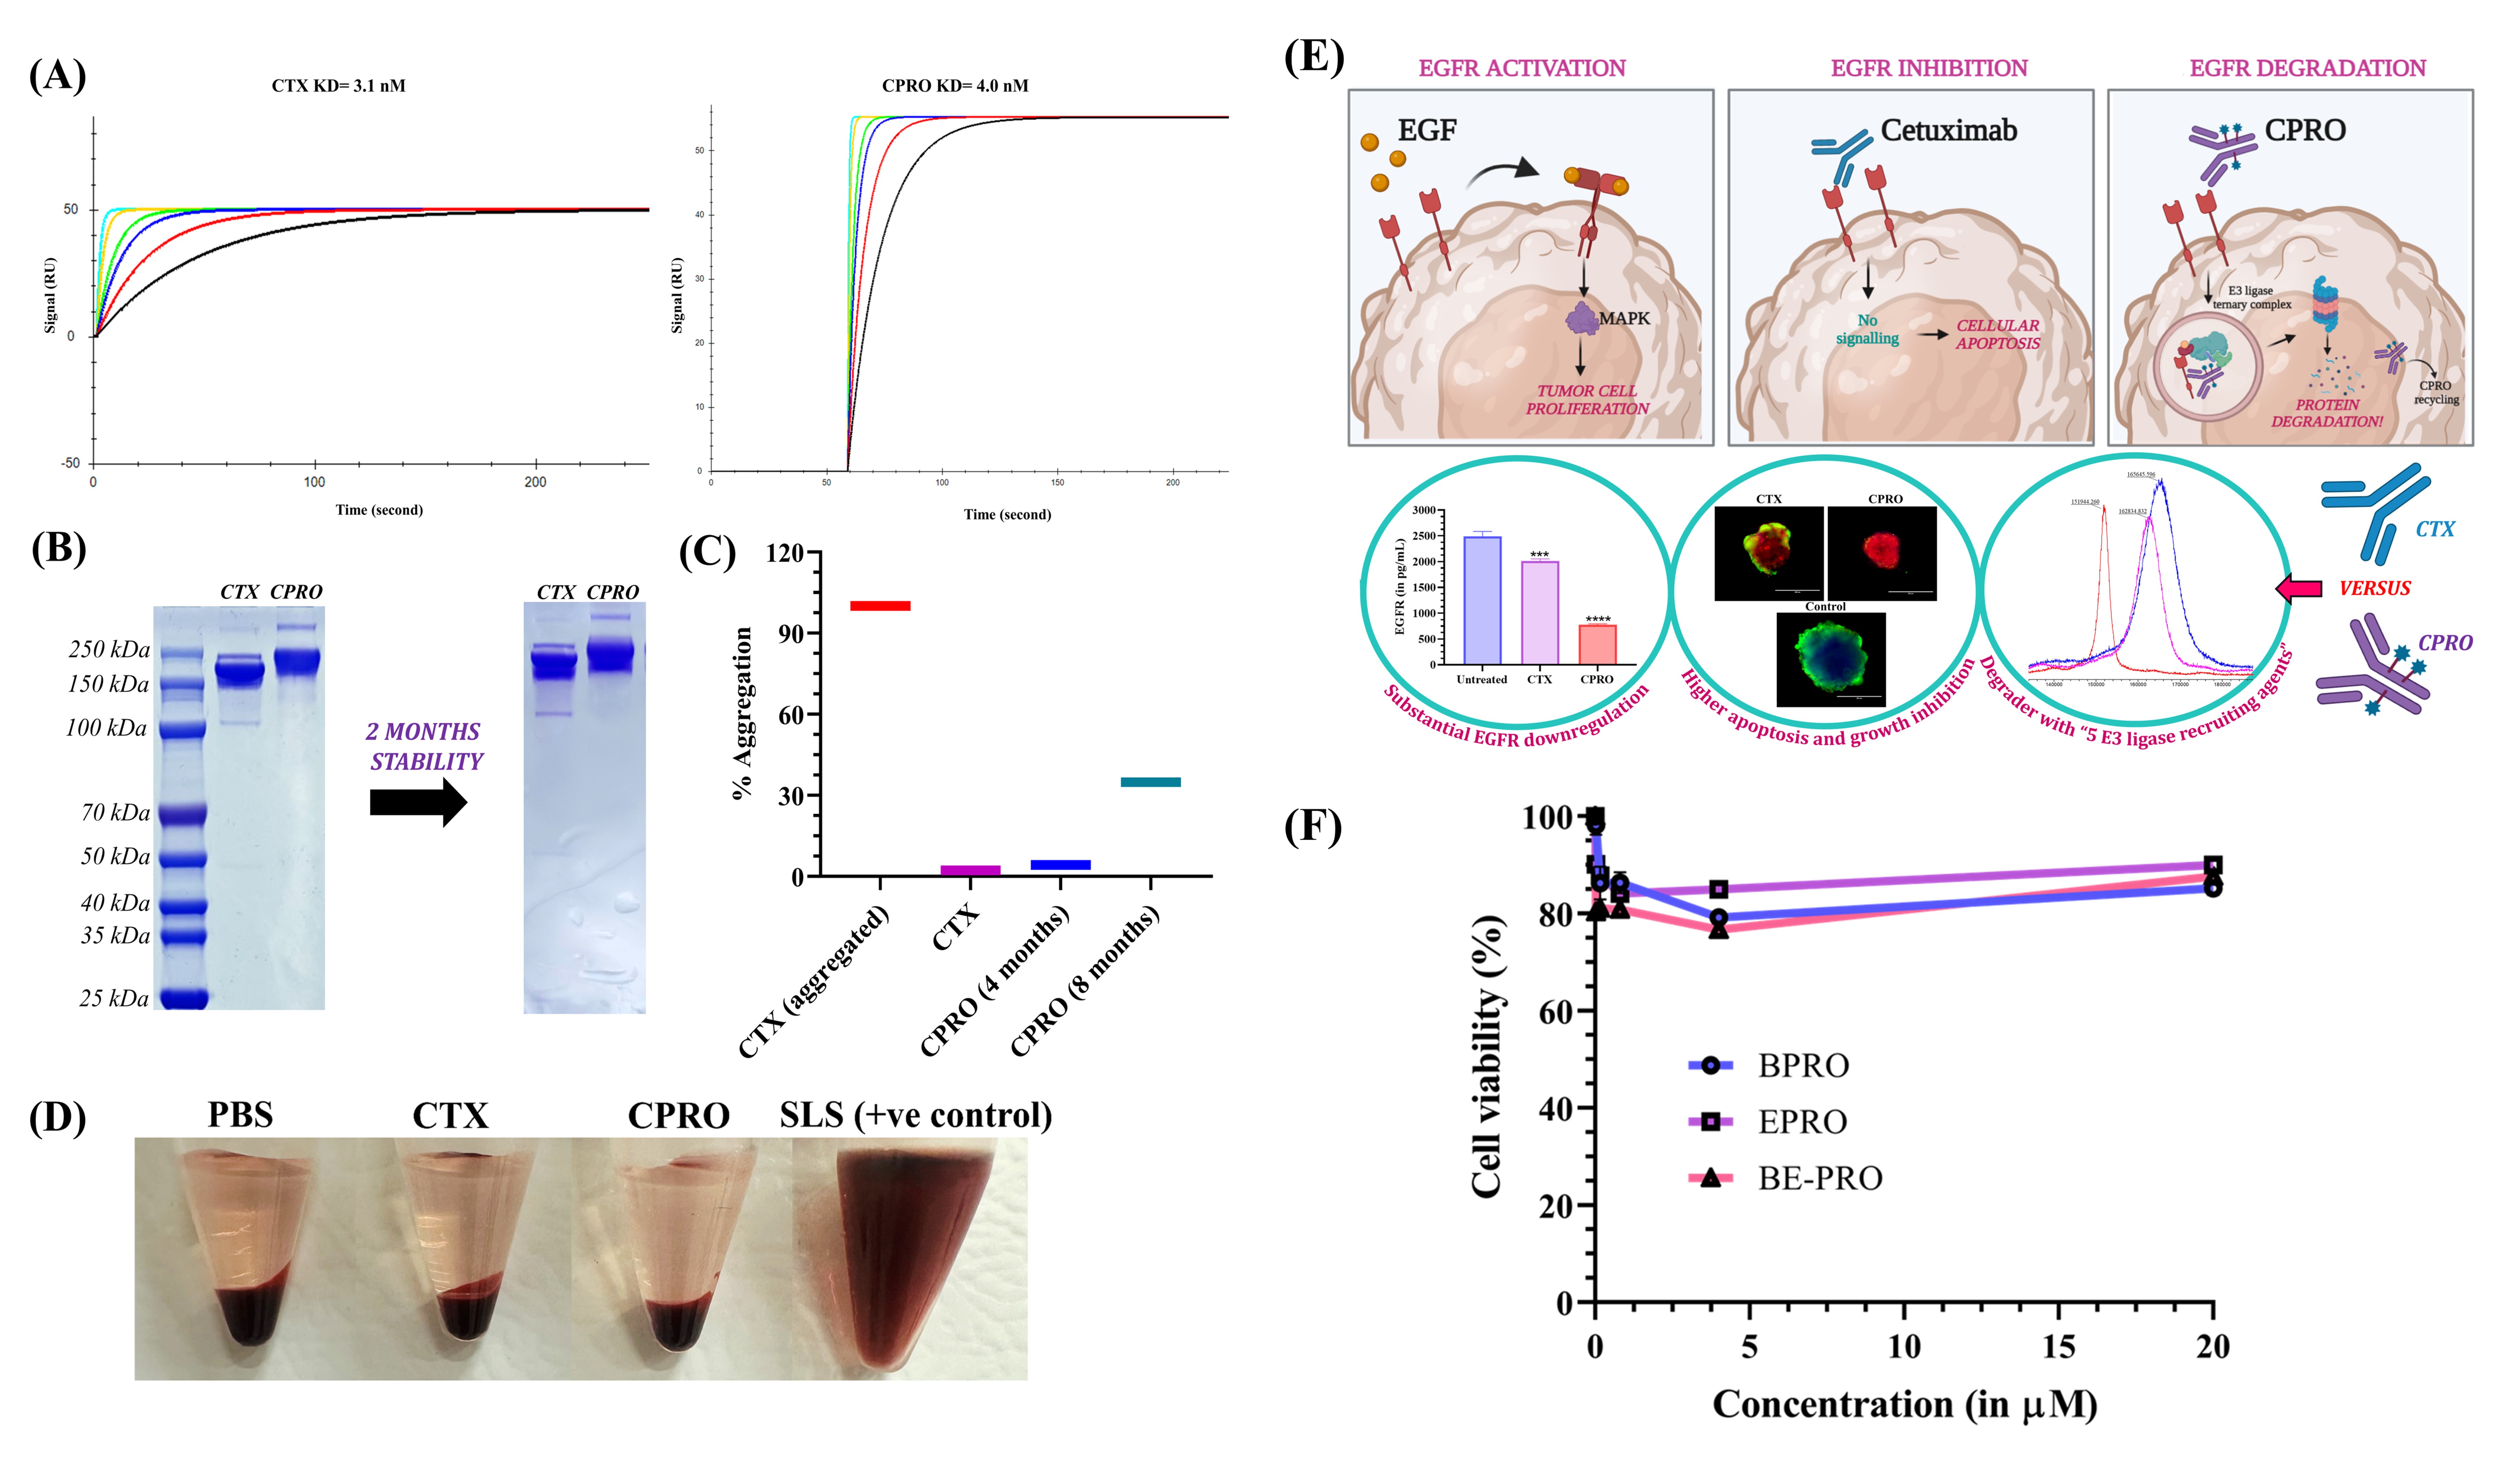 Figure 2. (A) Surface plasmon resonance of CTX and CPRO. (B) SDS-PAGE analysis of CTX and CPRO on 4-12% polyacrylamide gel. (C) % Protein aggregation estimation post 4- and 8-months stability. (D) In vitro hemolysis study of CTX and CPRO compared to negative control, phosphate buffer and positive control, sodium lauryl sulfate. (E) Schematic representation comparing the advantages of CPRO over its native mAb, CTX. (F) In vitro biocompatibility study of CTX and CPRO in HEK-293 cells. Each data represents n=3.
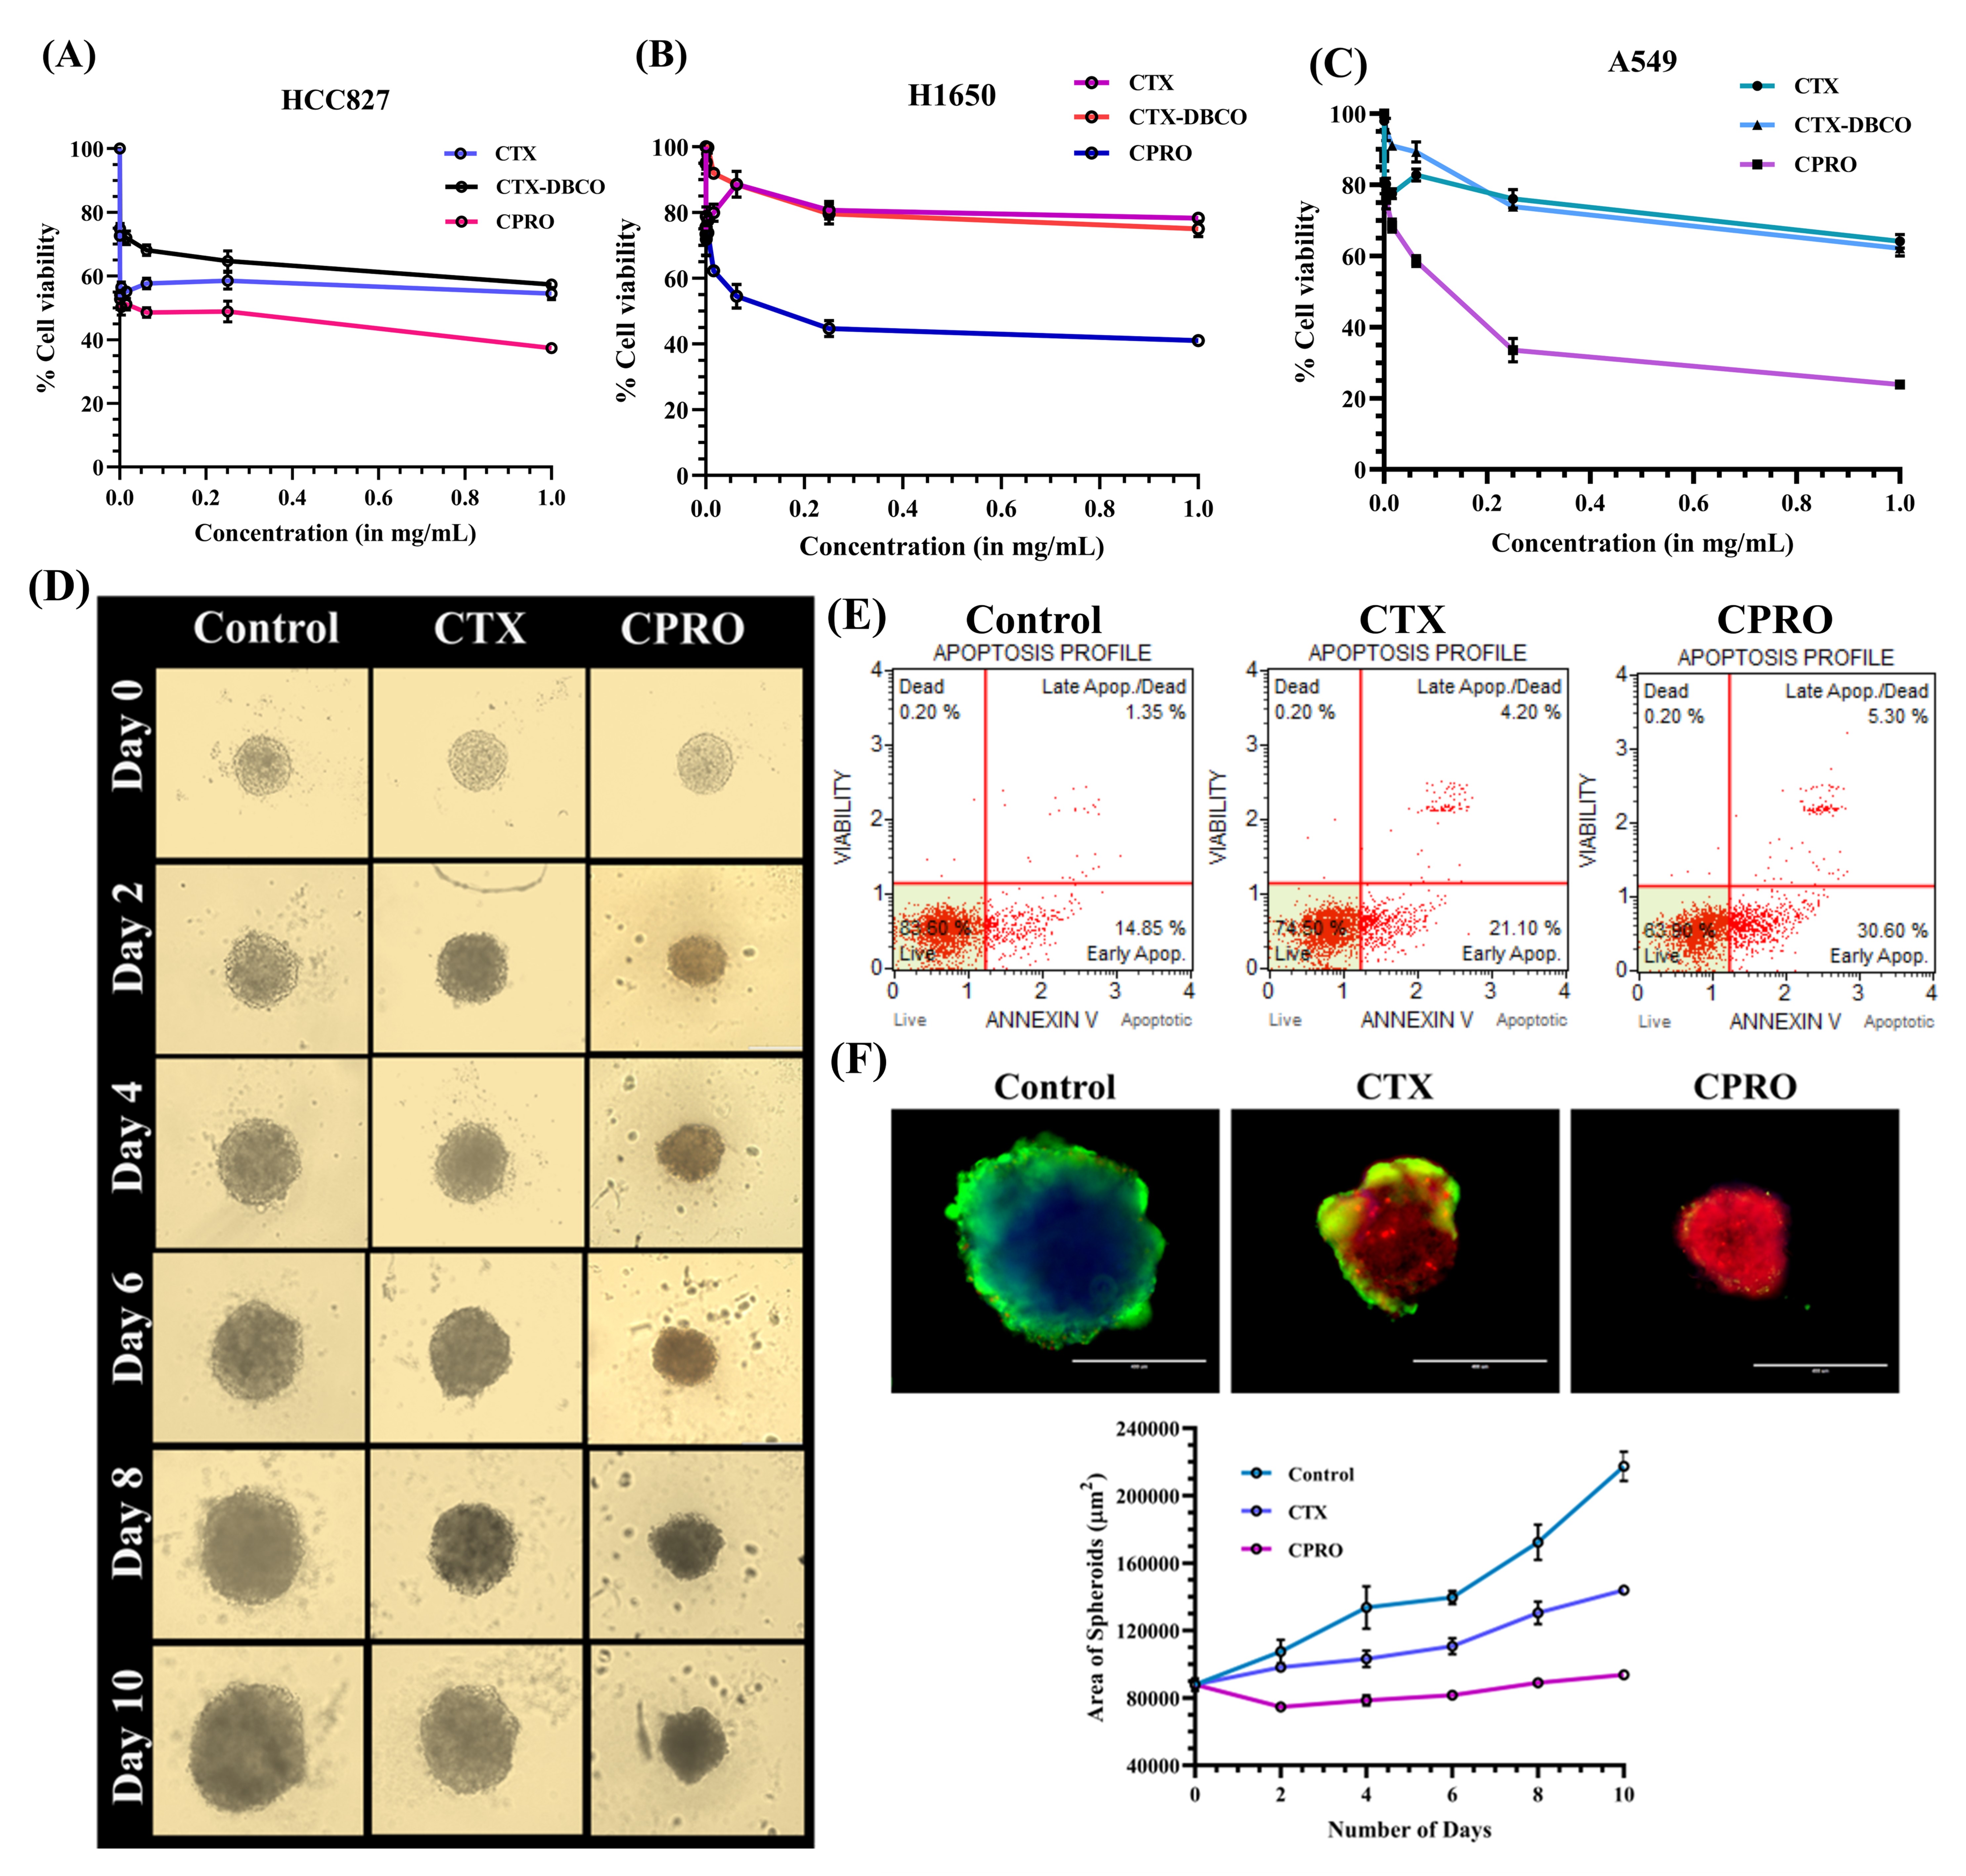 Figure 3. In vitro cytotoxicity of CTX, CTX-DBCO and CPRO post 72 h incubation in NSCLC cell lines with varied EGFR mutations (A) HCC827, (B) H1650, (C) A549. (D) Representative images of spheroids exposed to CTX and CPRO individually. (E) Flow cytometric analysis of live, apoptotic and dead cells in different subtypes of NSCLC cells post-treatment of native CTX and CPRO. (F) Evaluation of spheroid growth area post treatment exposure compared to control. Fluorescence images portraying apoptotic profile of spheroids post treatment. Composite images of DAPI (blue), calcein-AM (green) and EthD-1 (red).