
Formulation and Delivery - Biomolecular
Category: Poster Abstract
Mimansa Goyal, Ph.D. (she/her/hers)
St. John's University
Flushing, New York, United States
Mimansa Goyal, Ph.D. (she/her/hers)
St. John's University
Flushing, New York, United States
Vivek Gupta, Ph.D. (he/him/his)
St. John's University
New York, New York, United States
.jpg) Figure 1. (A) Different Carmofur-NP formulation based on DoE model. Graphical representation of (B) Drug Loading and (C) Particle Size. (D) In-vitro release of Carmofur-NP through dialysis method in Simulated Lung Fluid. (E) Higuchi Kinetics represent best fit model of in-vitro release. In vitro aerodynamic performance of Carmofur-NP. (F) In-vitro aerodynamic deposition of Carmofur-NP in Next-Generation ImpactorTM (NGI) stages (G) % cumulative deposition of Carmofur-NP in NGI. (H) Aerosolization properties of Carmofur-NP complex. Data represent mean ± SD (n = 3).
Figure 1. (A) Different Carmofur-NP formulation based on DoE model. Graphical representation of (B) Drug Loading and (C) Particle Size. (D) In-vitro release of Carmofur-NP through dialysis method in Simulated Lung Fluid. (E) Higuchi Kinetics represent best fit model of in-vitro release. In vitro aerodynamic performance of Carmofur-NP. (F) In-vitro aerodynamic deposition of Carmofur-NP in Next-Generation ImpactorTM (NGI) stages (G) % cumulative deposition of Carmofur-NP in NGI. (H) Aerosolization properties of Carmofur-NP complex. Data represent mean ± SD (n = 3). 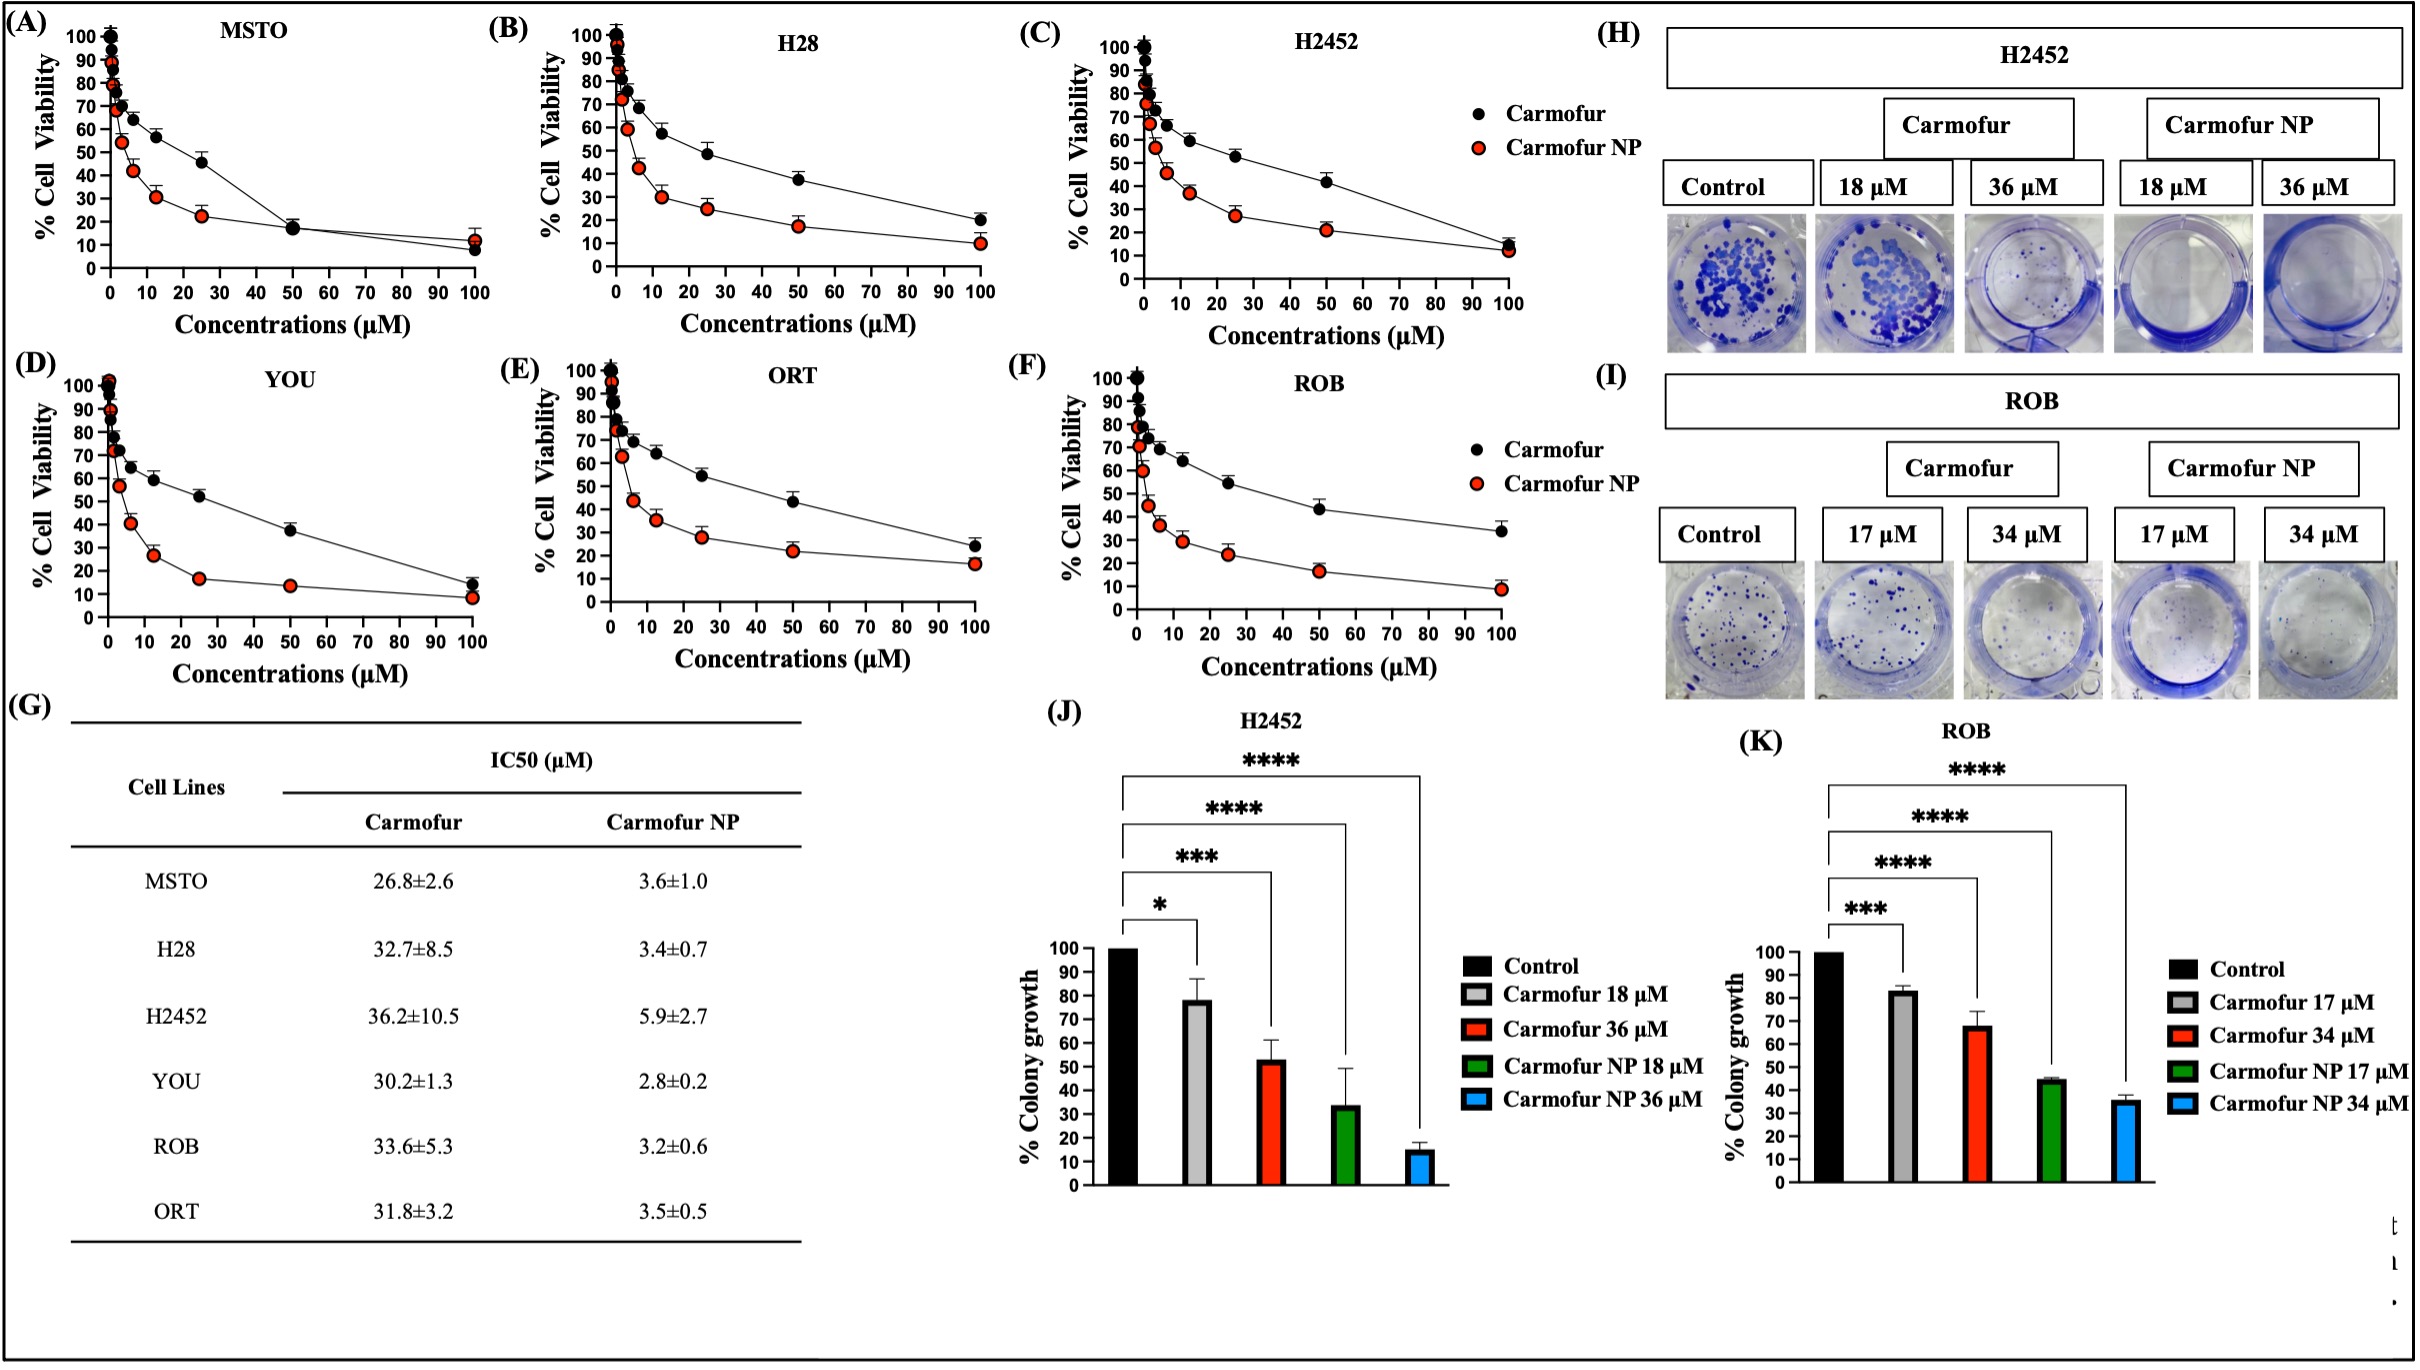 Figure 2. Cytotoxicity Assay of Carmofur in immortalized cell lines namely (A) MSTO, (B) H28 and (C) H2452 and patient derived cell lines (D) YOU, (E) ORT and (F) ROB. (G) Tabular representation of IC50 values of Carmofur and Carmofur-NPs in different MPM cell lines. Colony inhibition assay was performed in (H) H2452 and (I) ROB cell lines for 48 hours. Quantification of colonies treated with different treatment groups in (J) H2452 and (K) ROB. Data represent mean ± SD (n = 3).
 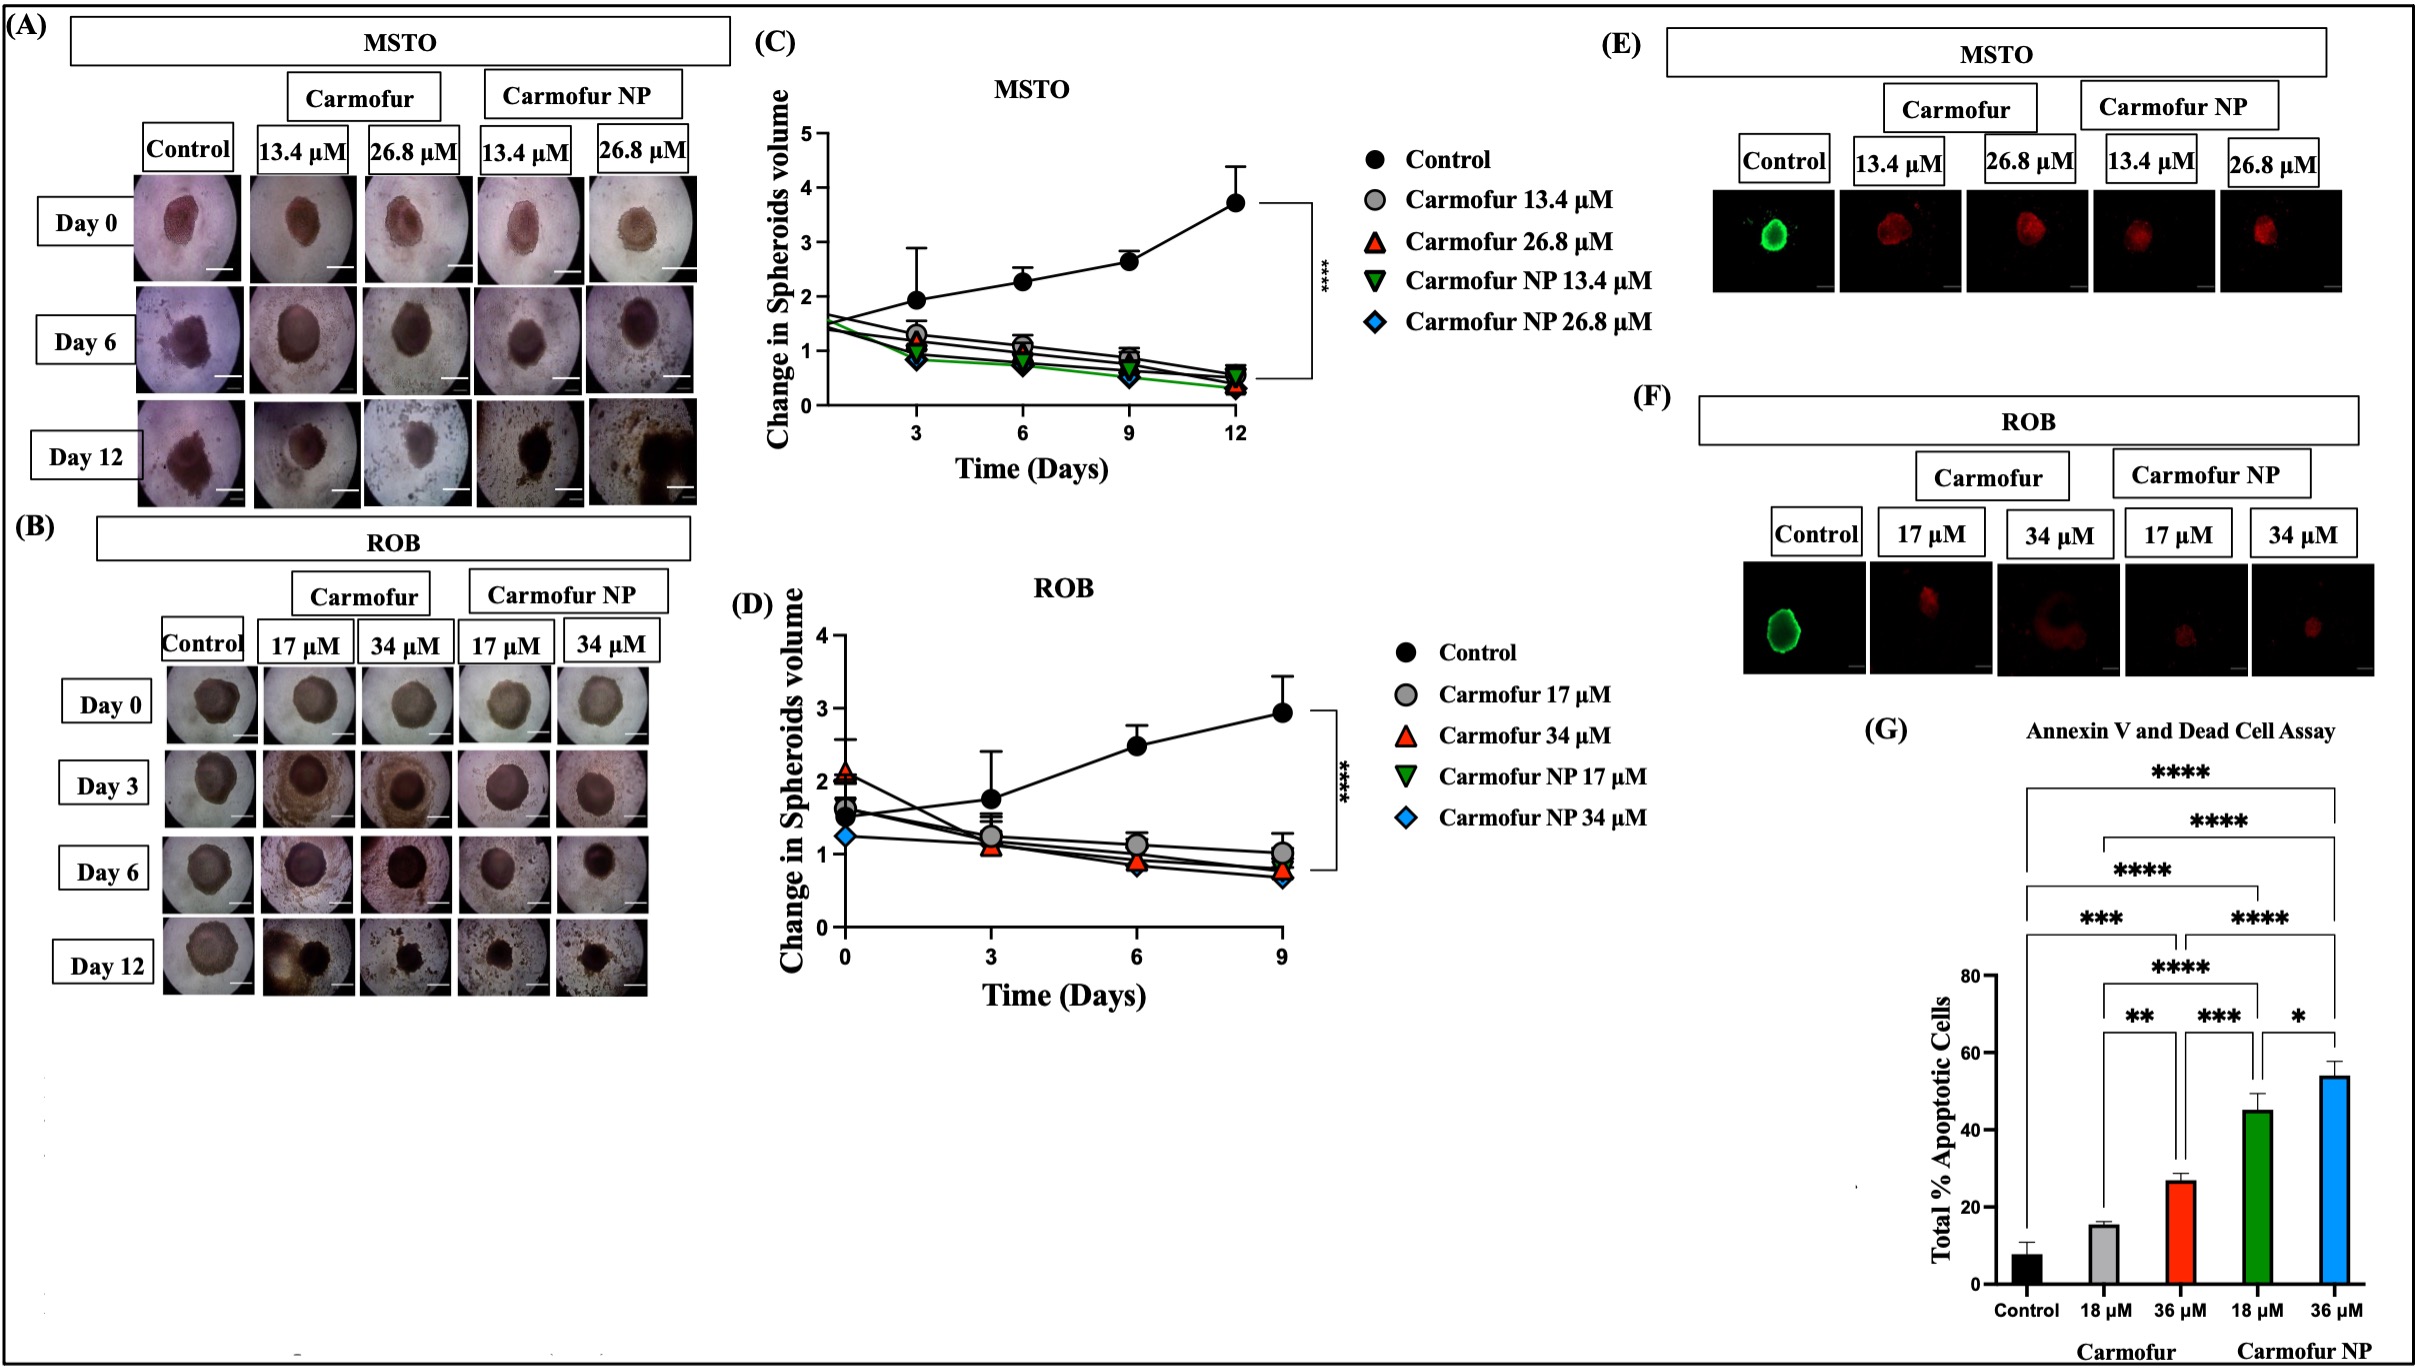 Figure 3. 3D tumor simulation studies. Effect of treatment on the growth of the tumor in 3D spheroids study of (A) MSTO and (B) ROB in therapeutic model. Images demonstrate the spheroids on day 0 to day 12 after single dose treatment. (C) and (D) Represents spheroids volume vs time (days) plot in MSTO and ROB respectively. Spheroids were treated on day 0 (3rd day of growing spheroids). Data represent mean ± SEM (n = 8). Qualitative and quantitative assessment of anti-tumorigenic activity of Carmofur and Carmofur-NPs. (E) and (F) Fluorescent images of spheroids been subjected to live-dead assay on day 12 in MSTO and ROB respectively. Data represents mean ± SD (n=8), **p < 0.01, ***p < 0.001,****p < 0.0001 shows comparison between different treatment groups. Scalebar = 200𝛍m. Detection of apoptosis using Annexin V and Dead Cell Assay in H2452. (G) Represents total % apoptotic H2452 cells due to exposure to different concentration of Carmofur and Carmofur-NPs for 24 hours. Data represents mean ± SD (n=3).