
Formulation and Delivery - Chemical
Category: Poster Abstract
 photo")
Mustafa Bookwala, MS (he/him/his)
Ph.D. Candidate
Duquesne University
Pittsburgh, Pennsylvania, United States
Mustafa Bookwala, MS (he/him/his)
Ph.D. Candidate
Duquesne University
Pittsburgh, Pennsylvania, United States
Peter L.D. Wildfong, Ph.D. (he/him/his)
Duquesne University
Pittsburgh, Pennsylvania, United States
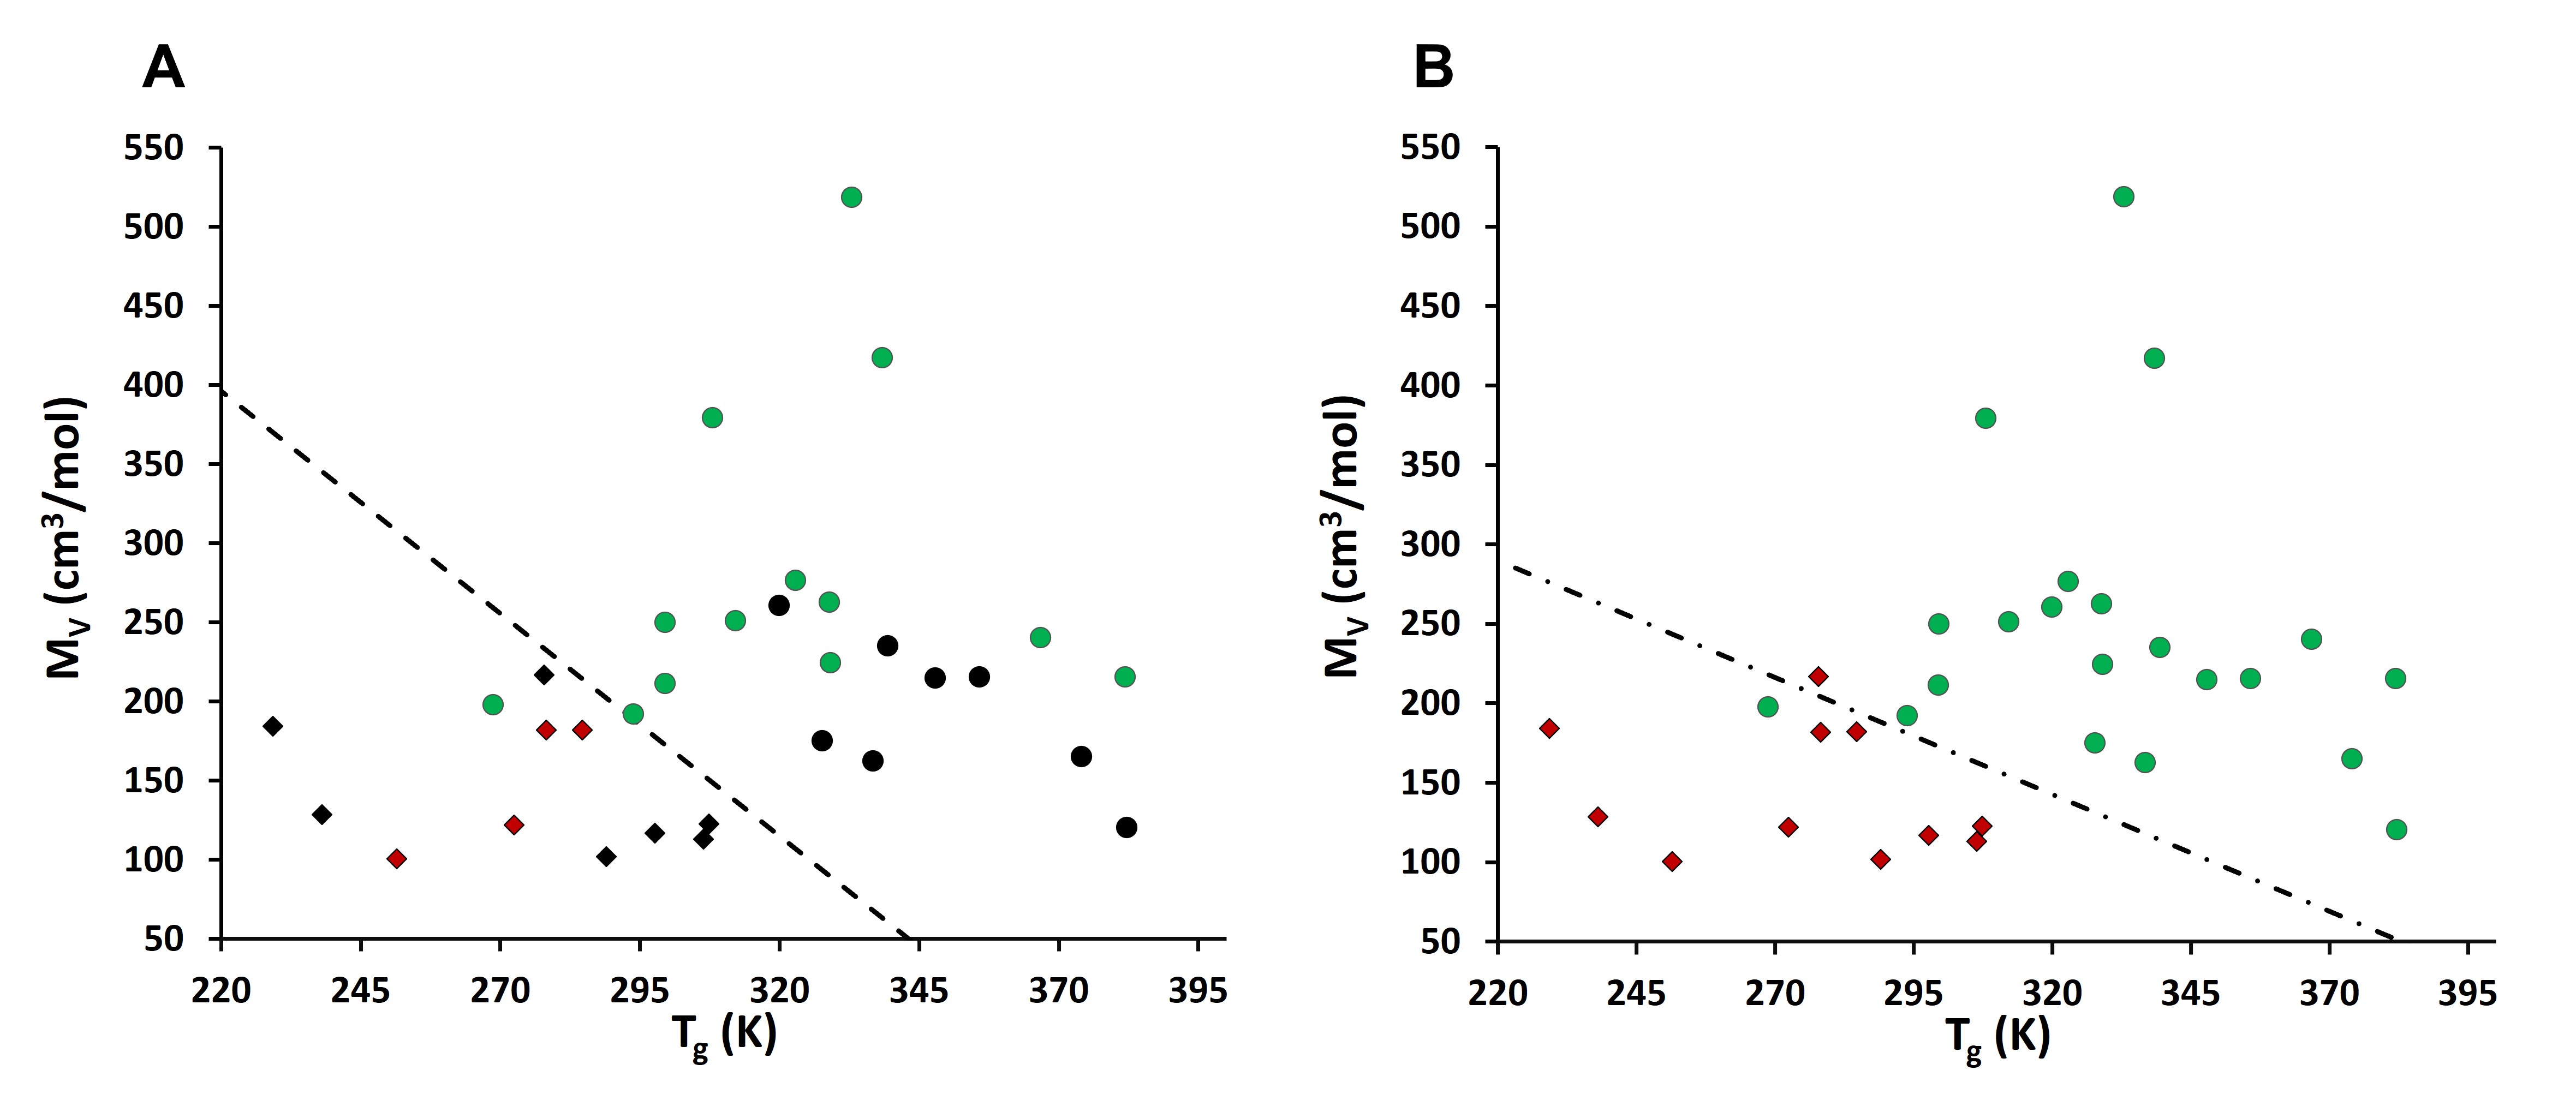 Figure 1: Bivariate plots of the joint distribution of Tg and MV where circle represents complete disordering observed and diamonds represents material resistant to disordering. A) The classification boundary from the model developed by Lin et al. (1). The black data points represent the original 17 materials, while red and green points represent the new materials (n = 15) added here that test the previously established model. b) The updated bivariate empirical model with a classification boundary recalibrated with the expanded dataset (n = 32).
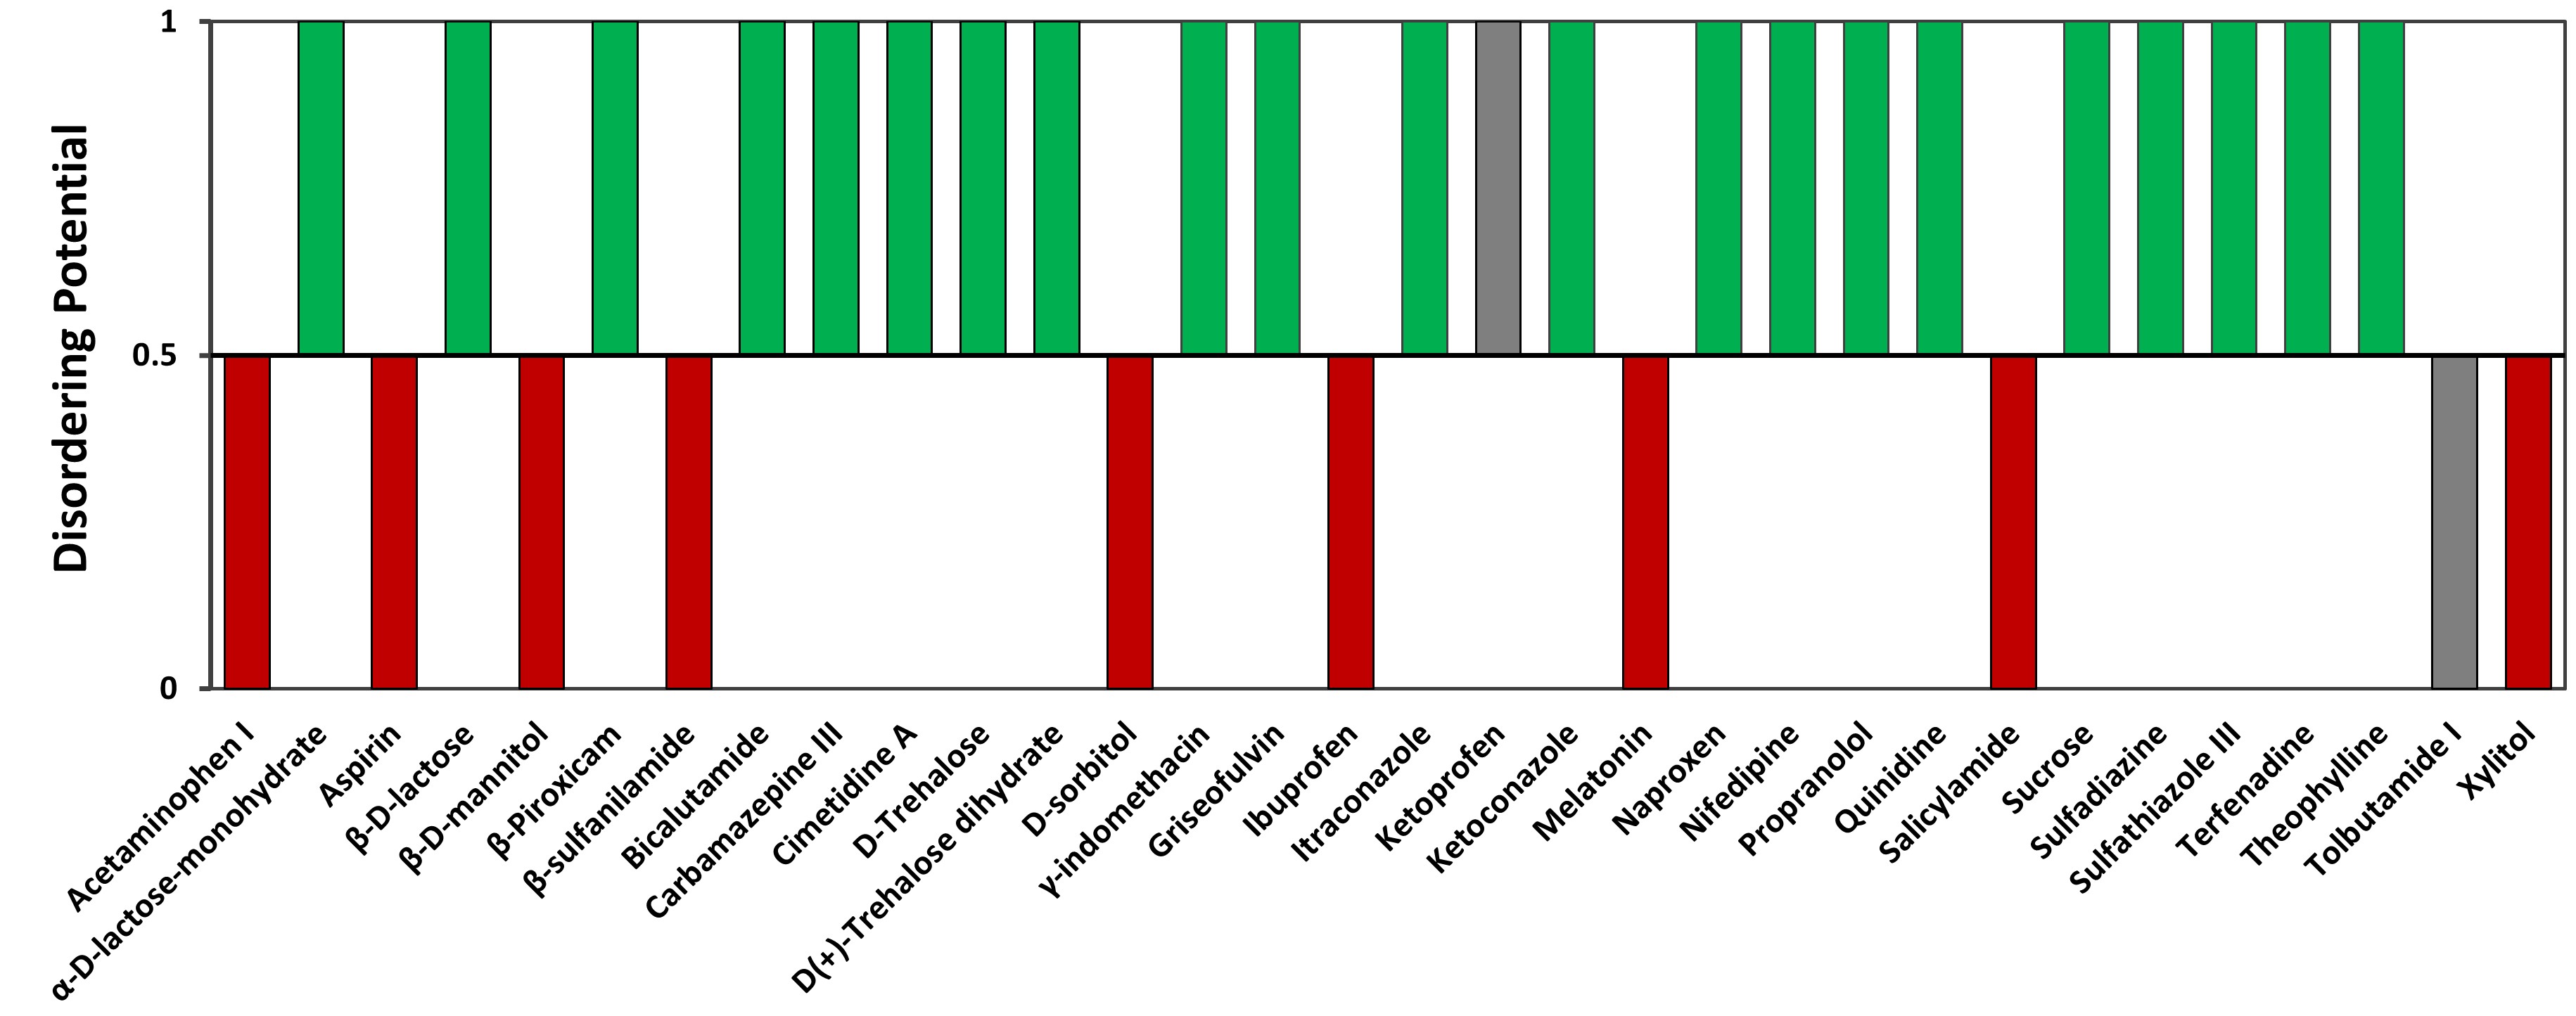 Figure 2: Illustration of the experimental disordering potential for 32 materials; (0 = Resistant to Complete Disordering; 1 = Complete Disordering). Red and green bars indicate correct classification (grey bars reflect incorrect classification) by the recalibrated bivariate model resulting in 94% prediction accuracy.