
Formulation and Delivery - Biomolecular
Category: Poster Abstract
 photo")
Aishwarya Saraswat, PhD (she/her/hers)
Senior Scientist
Regeneron Pharmaceuticals, Inc.
Tarrytown, New York, United States
Aishwarya Saraswat, Ph.D.
St. John's University
jamaica, New York, United States
Ketan Patel, Ph.D.
St. John's University
Jamaica, New York, United States
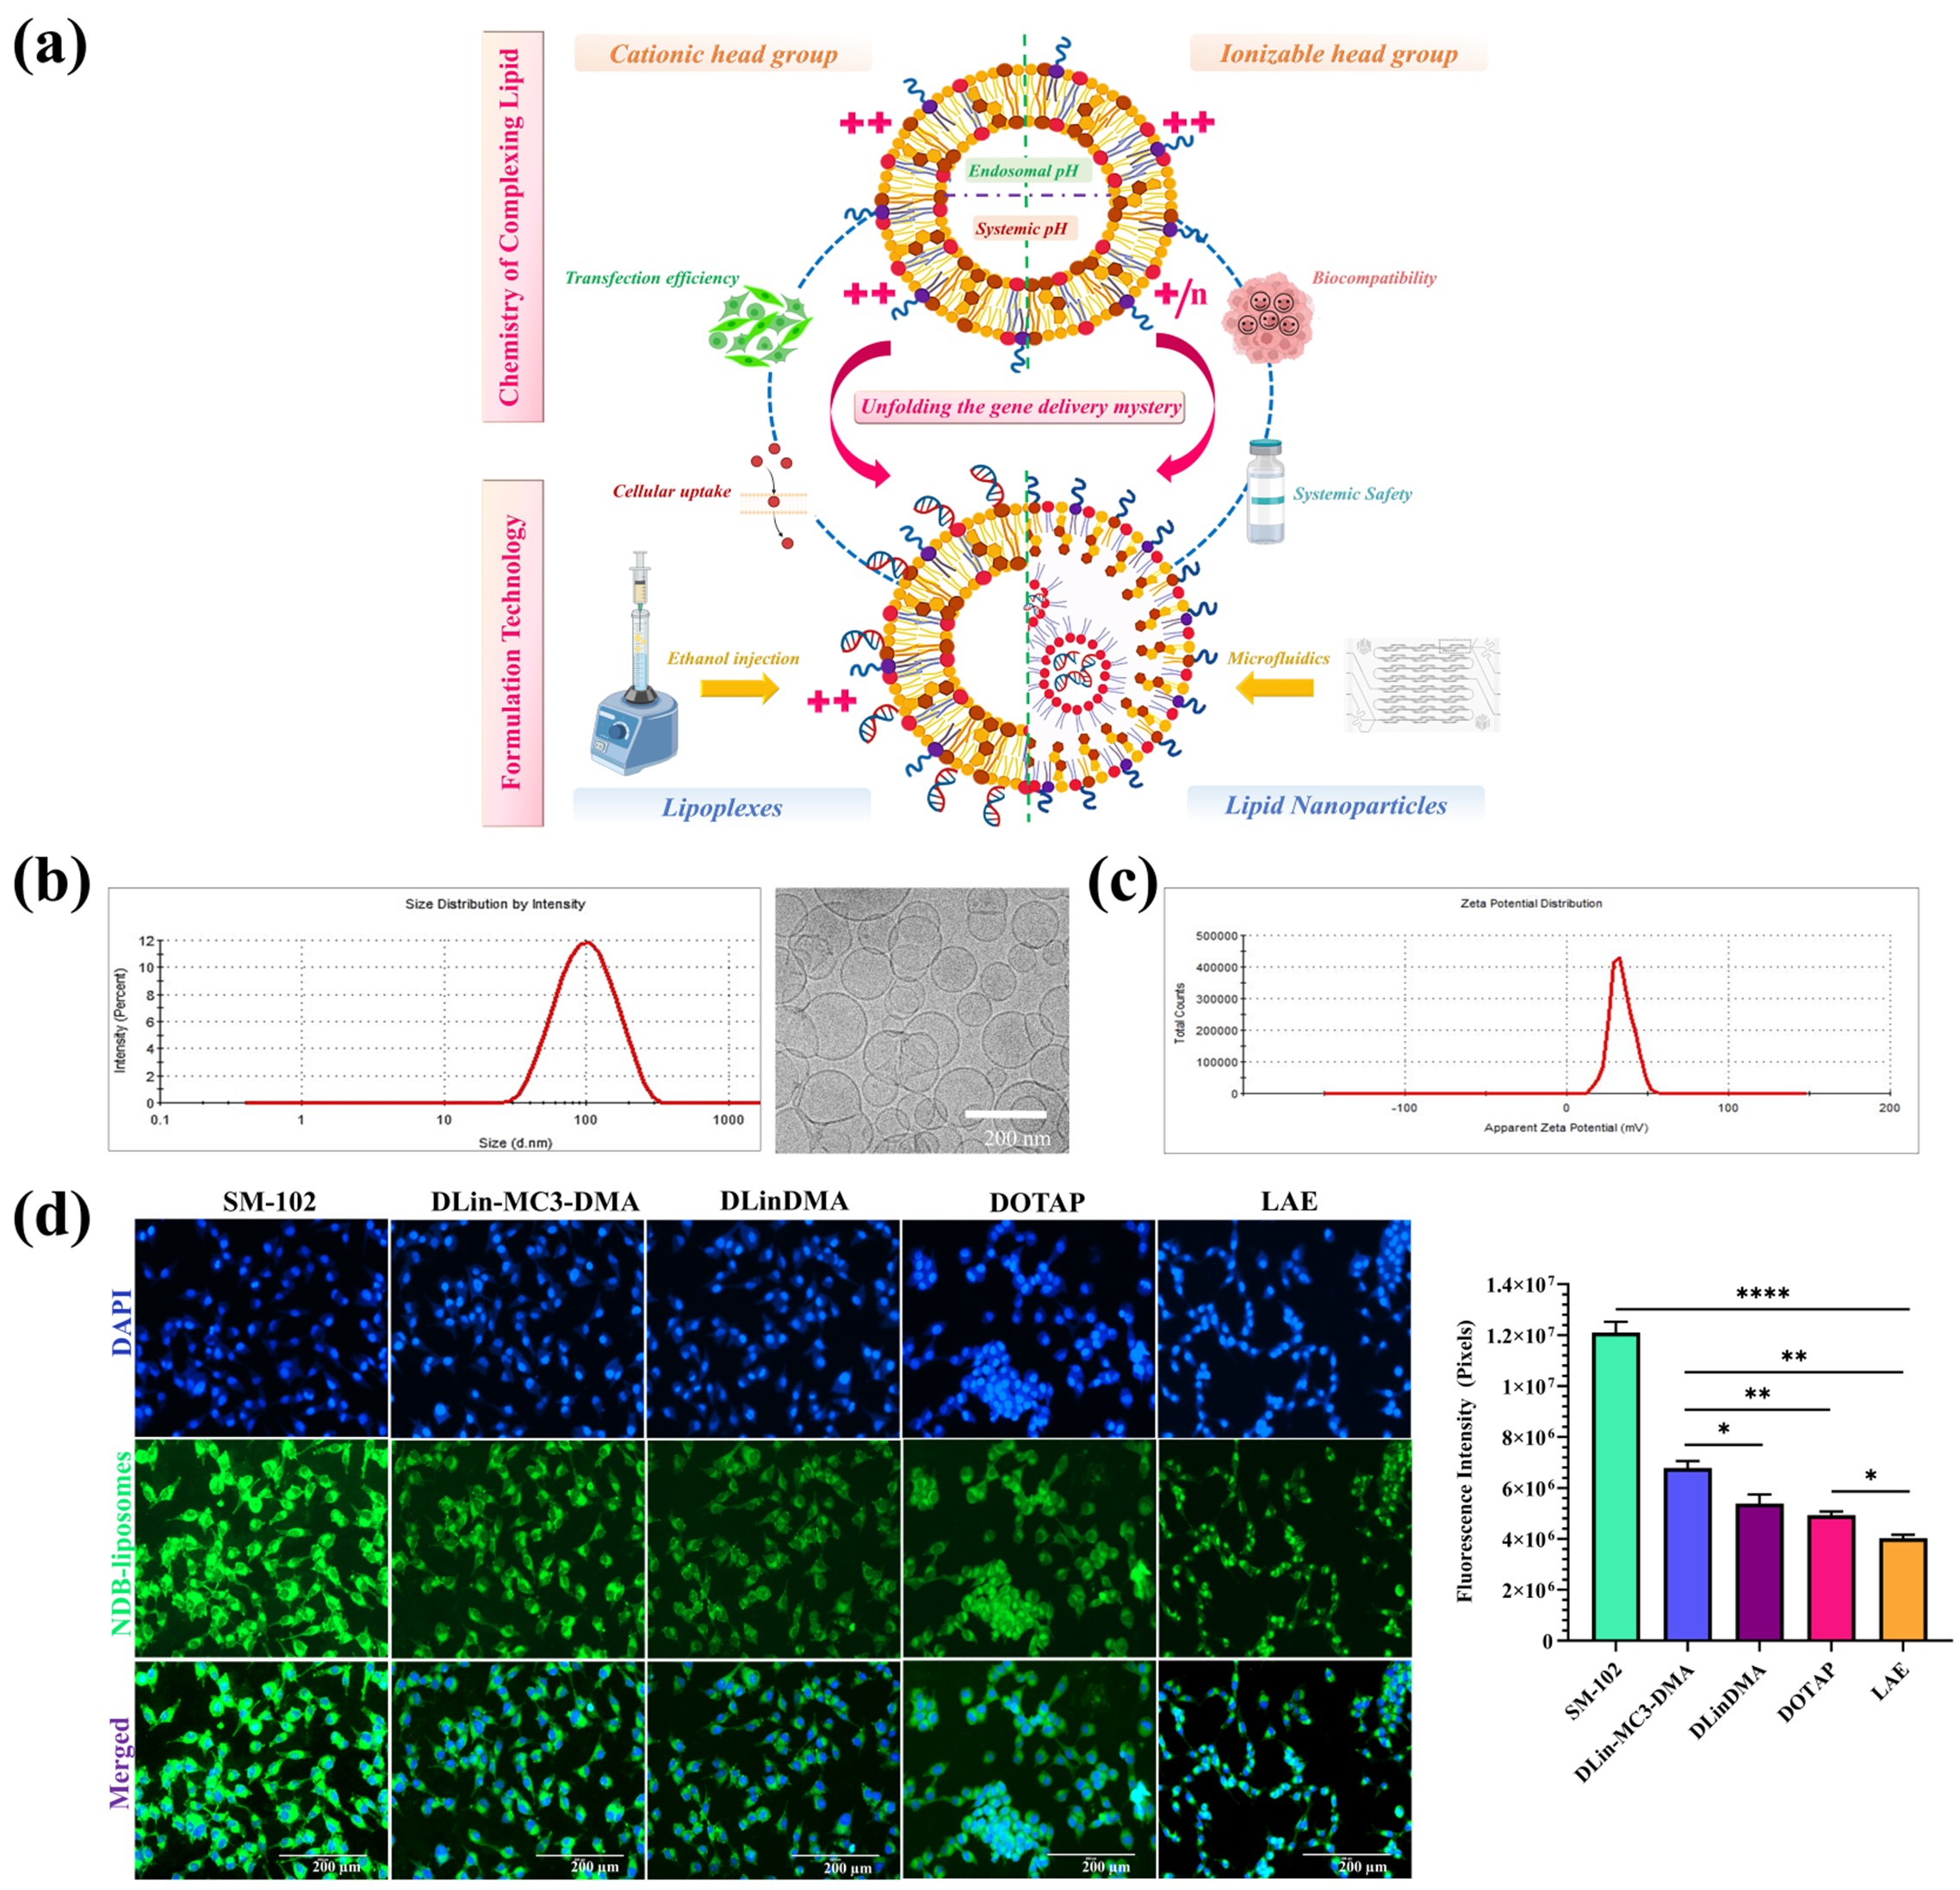 Fig. 1. (a) Schematic representation demonstrating parallel comparison of complexing head group and formulation technology for efficient pDNA delivery. (b) Dynamic light scattering graph and cryo-TEM image representing unimodal particle size distribution. (c) Dynamic light scattering graph demonstrating positive zeta potential of liposomal formulation containing SM-102 as ionizable lipid. (d) Fluorescence microscopy images and quantification of fluorescence intensity demonstrating cellular uptake of cationic/ionizable liposomes in A375R cells. Scale bar: 200 μm. *p < 0.05, **p < 0.01 and ****p < 0.0001.
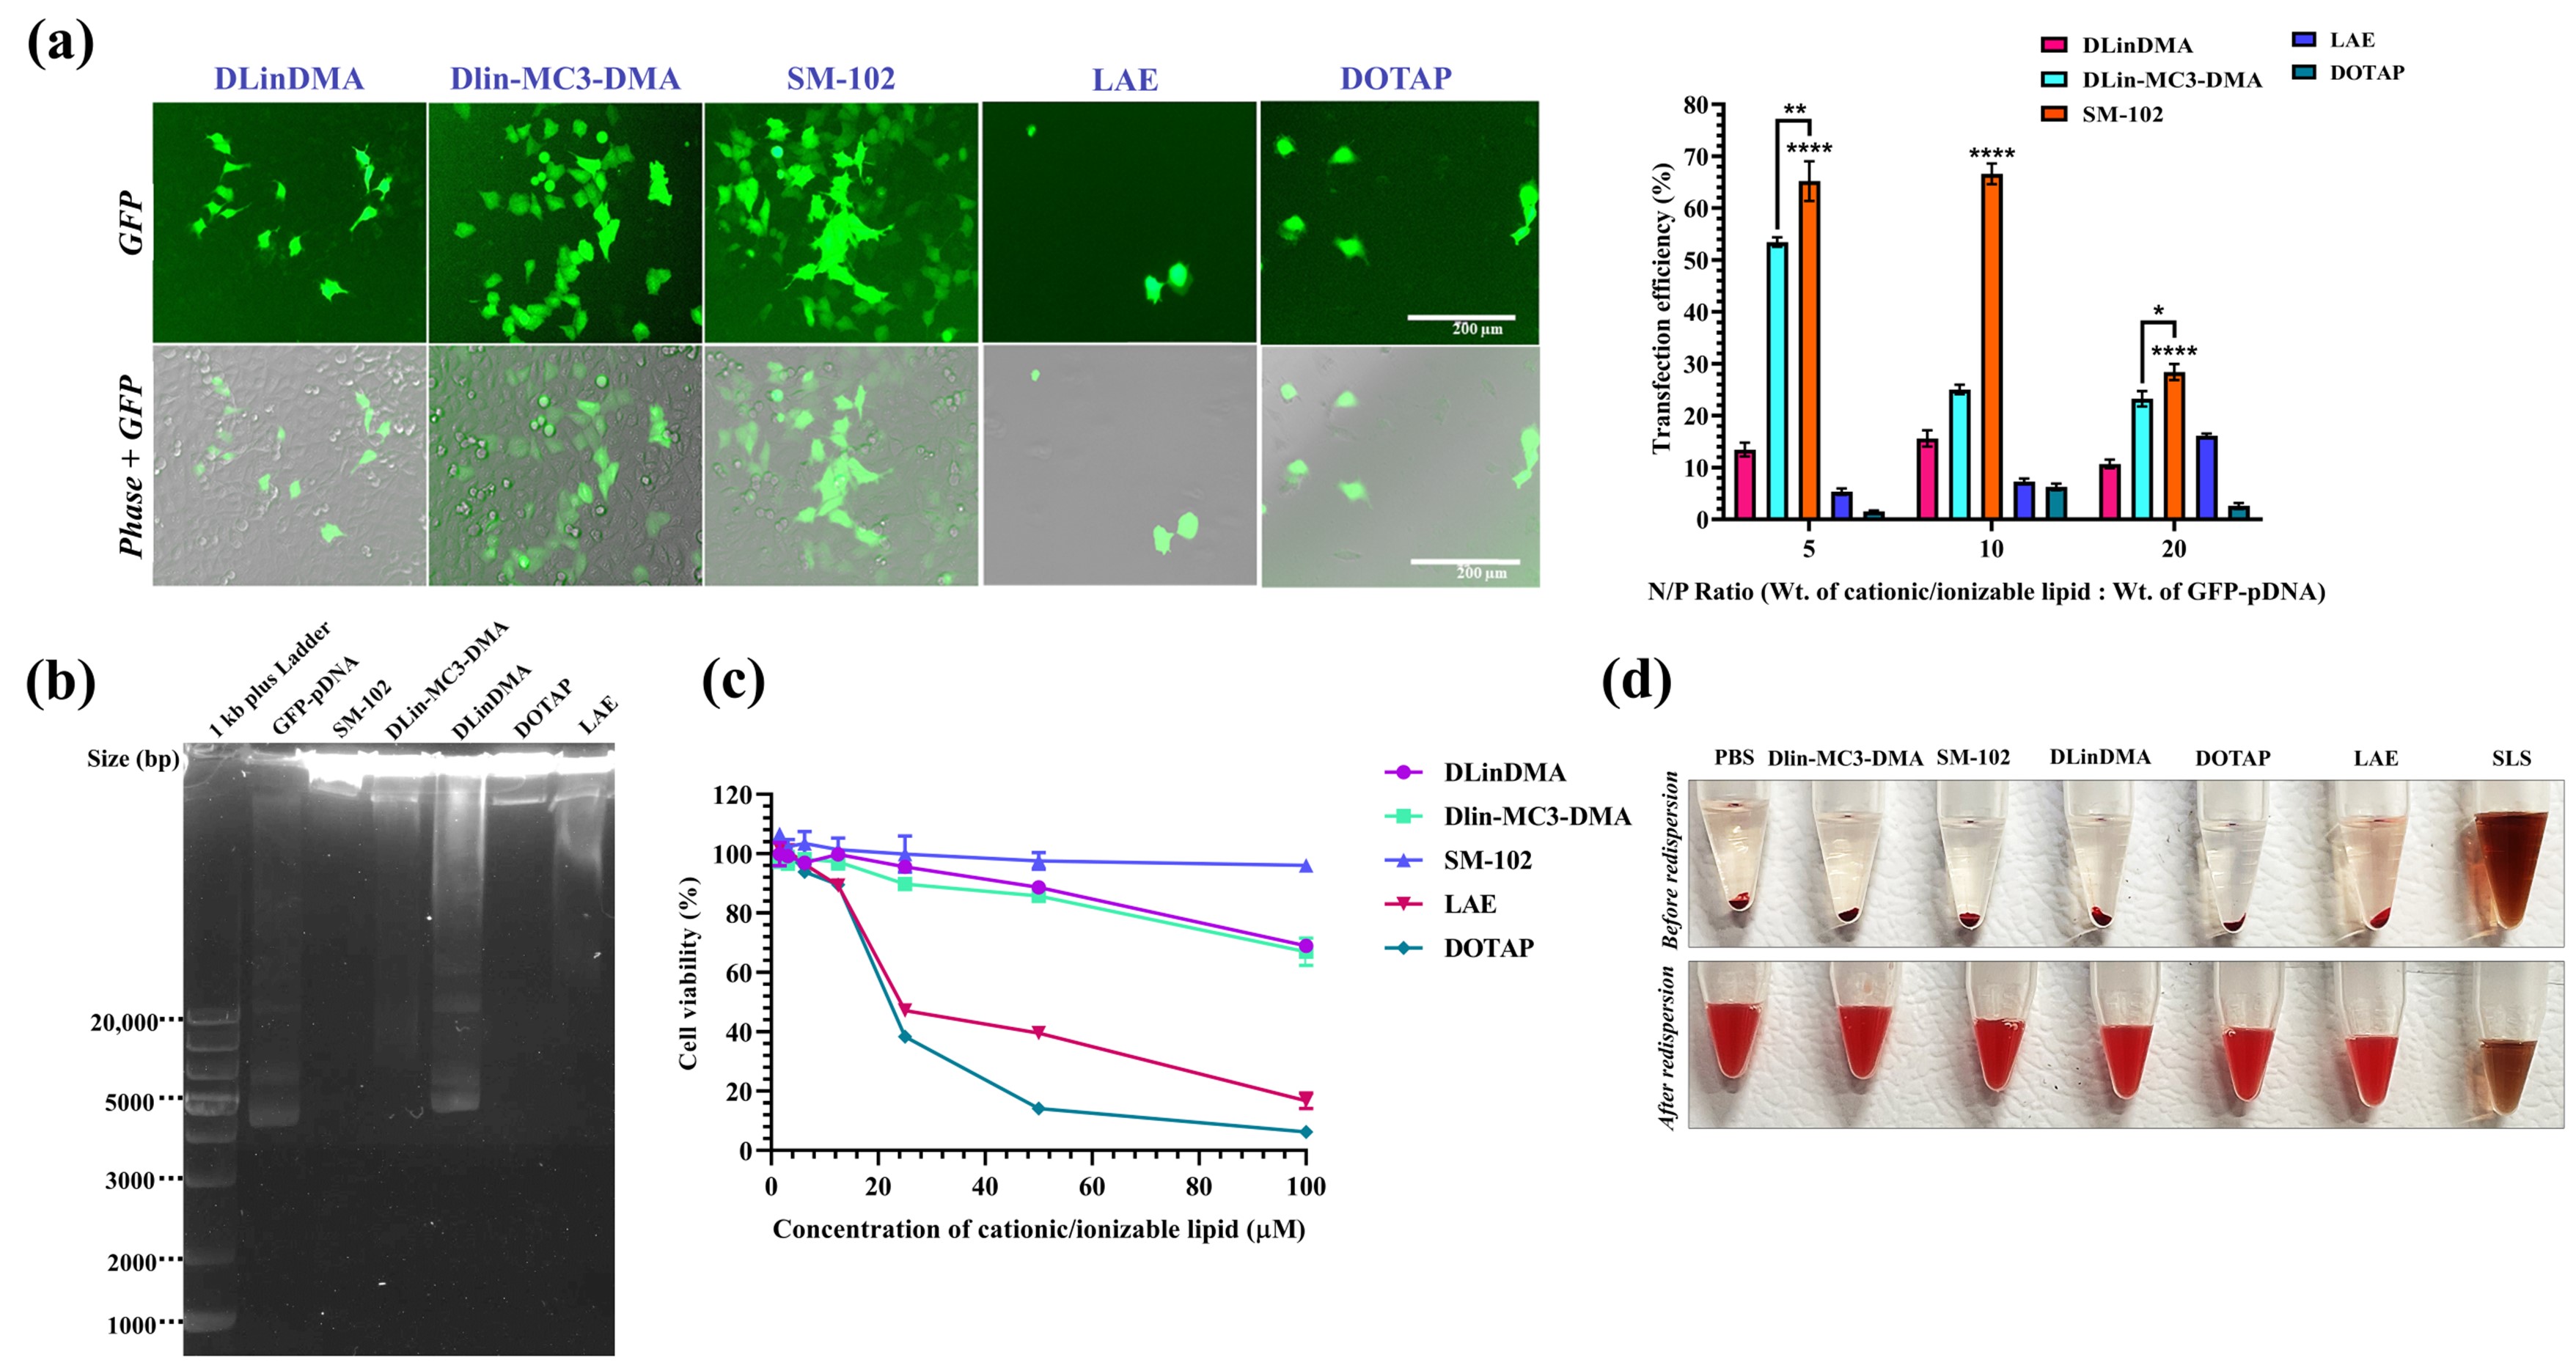 Fig. 2. (a) Fluorescence microscopy images and quantification of transfection efficiency of various lipoplexes at N/P ratio 5 following 48 h in A375R cells. Scale bar: 200 μm. (b) Agarose gel electrophoresis image illustrates binding efficiency of various cationic/ionizable liposomes for GFP-pDNA at N/P ratio of 5. (c) Cell viability curve of A375R cell line following treatment with cationic/ionizable liposomes as determined by MTT assay. (d) In vitro hemolysis study results indicating negligible hemolysis by most liposomal formulations except LAE. *p < 0.05, **p < 0.01 and ****p < 0.0001.
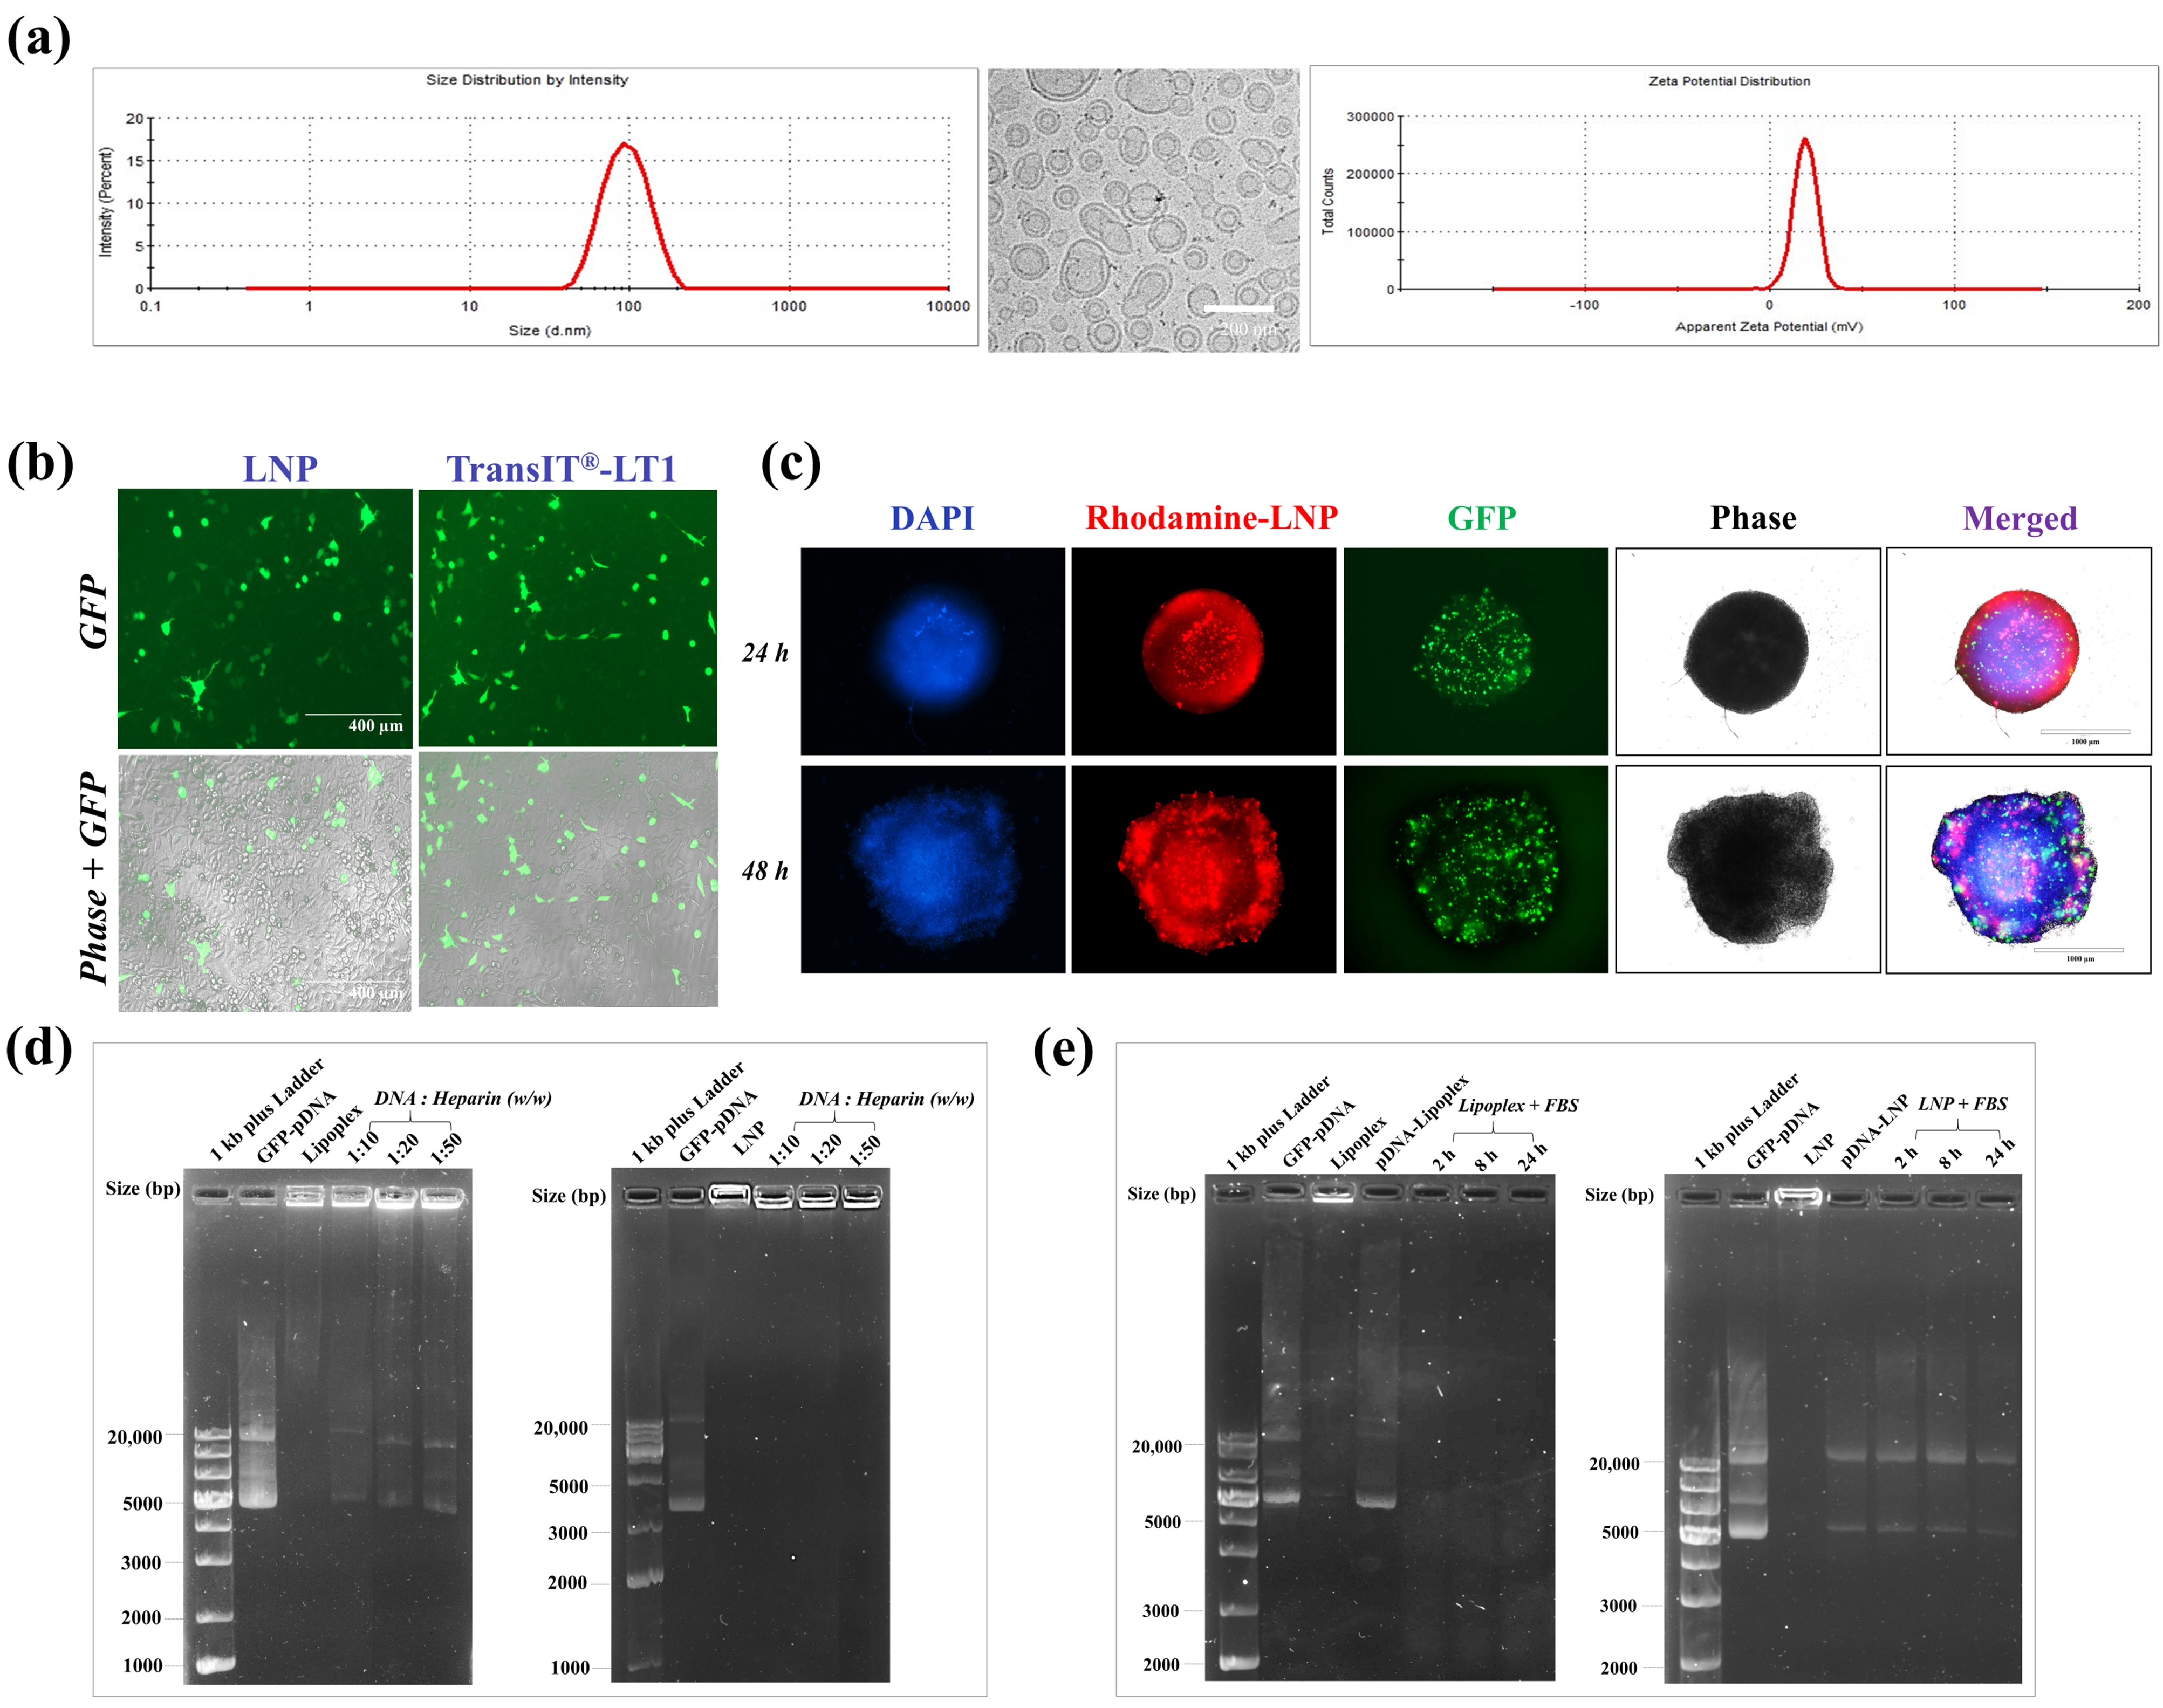 Fig. 3. (a) Dynamic light scattering graphs and cryo-TEM image demonstrating unimodal particle size distribution and neutral zeta potential of optimized LNPs. (b) Representative fluorescence microscopy images demonstrating transfection efficiency of LNPs following 48 h in A375R cells, comparable to TransIT®-LT1. Scale bar: 400 μm. (c) Fluorescence images of A375R 3D tumor spheroids illustrating significant uptake and penetration of Rhodamine labeled-LNPs and simultaneous transfection of GFP-pDNA following treatment. Scale bar: 1000 μm. (d). Representative agarose gel electrophoresis image illustrating higher binding stability of GFP-pDNA to LNPs when compared to lipoplexes as demonstrated by heparin displacement assay. (e) Representative agarose gel electrophoresis image showing stability of GFP-pDNA in presence of serum when complexed in form of LNPs as compared to lipoplexes.