
Formulation and Delivery - Chemical
Category: Poster Abstract
Vasudha Prithipaul, B.S. (she/her/hers)
St. John's University
Queens, New York, United States
Vasudha Prithipaul, B.S. (she/her/hers)
St. John's University
Queens, New York, United States
Druva Sarika Barji, Ph.D. (she/her/hers)
St. John's University
Malvern, Pennsylvania, United States
Nitesh Kunda, Ph.D.
St. John's University
New York, New York, United States
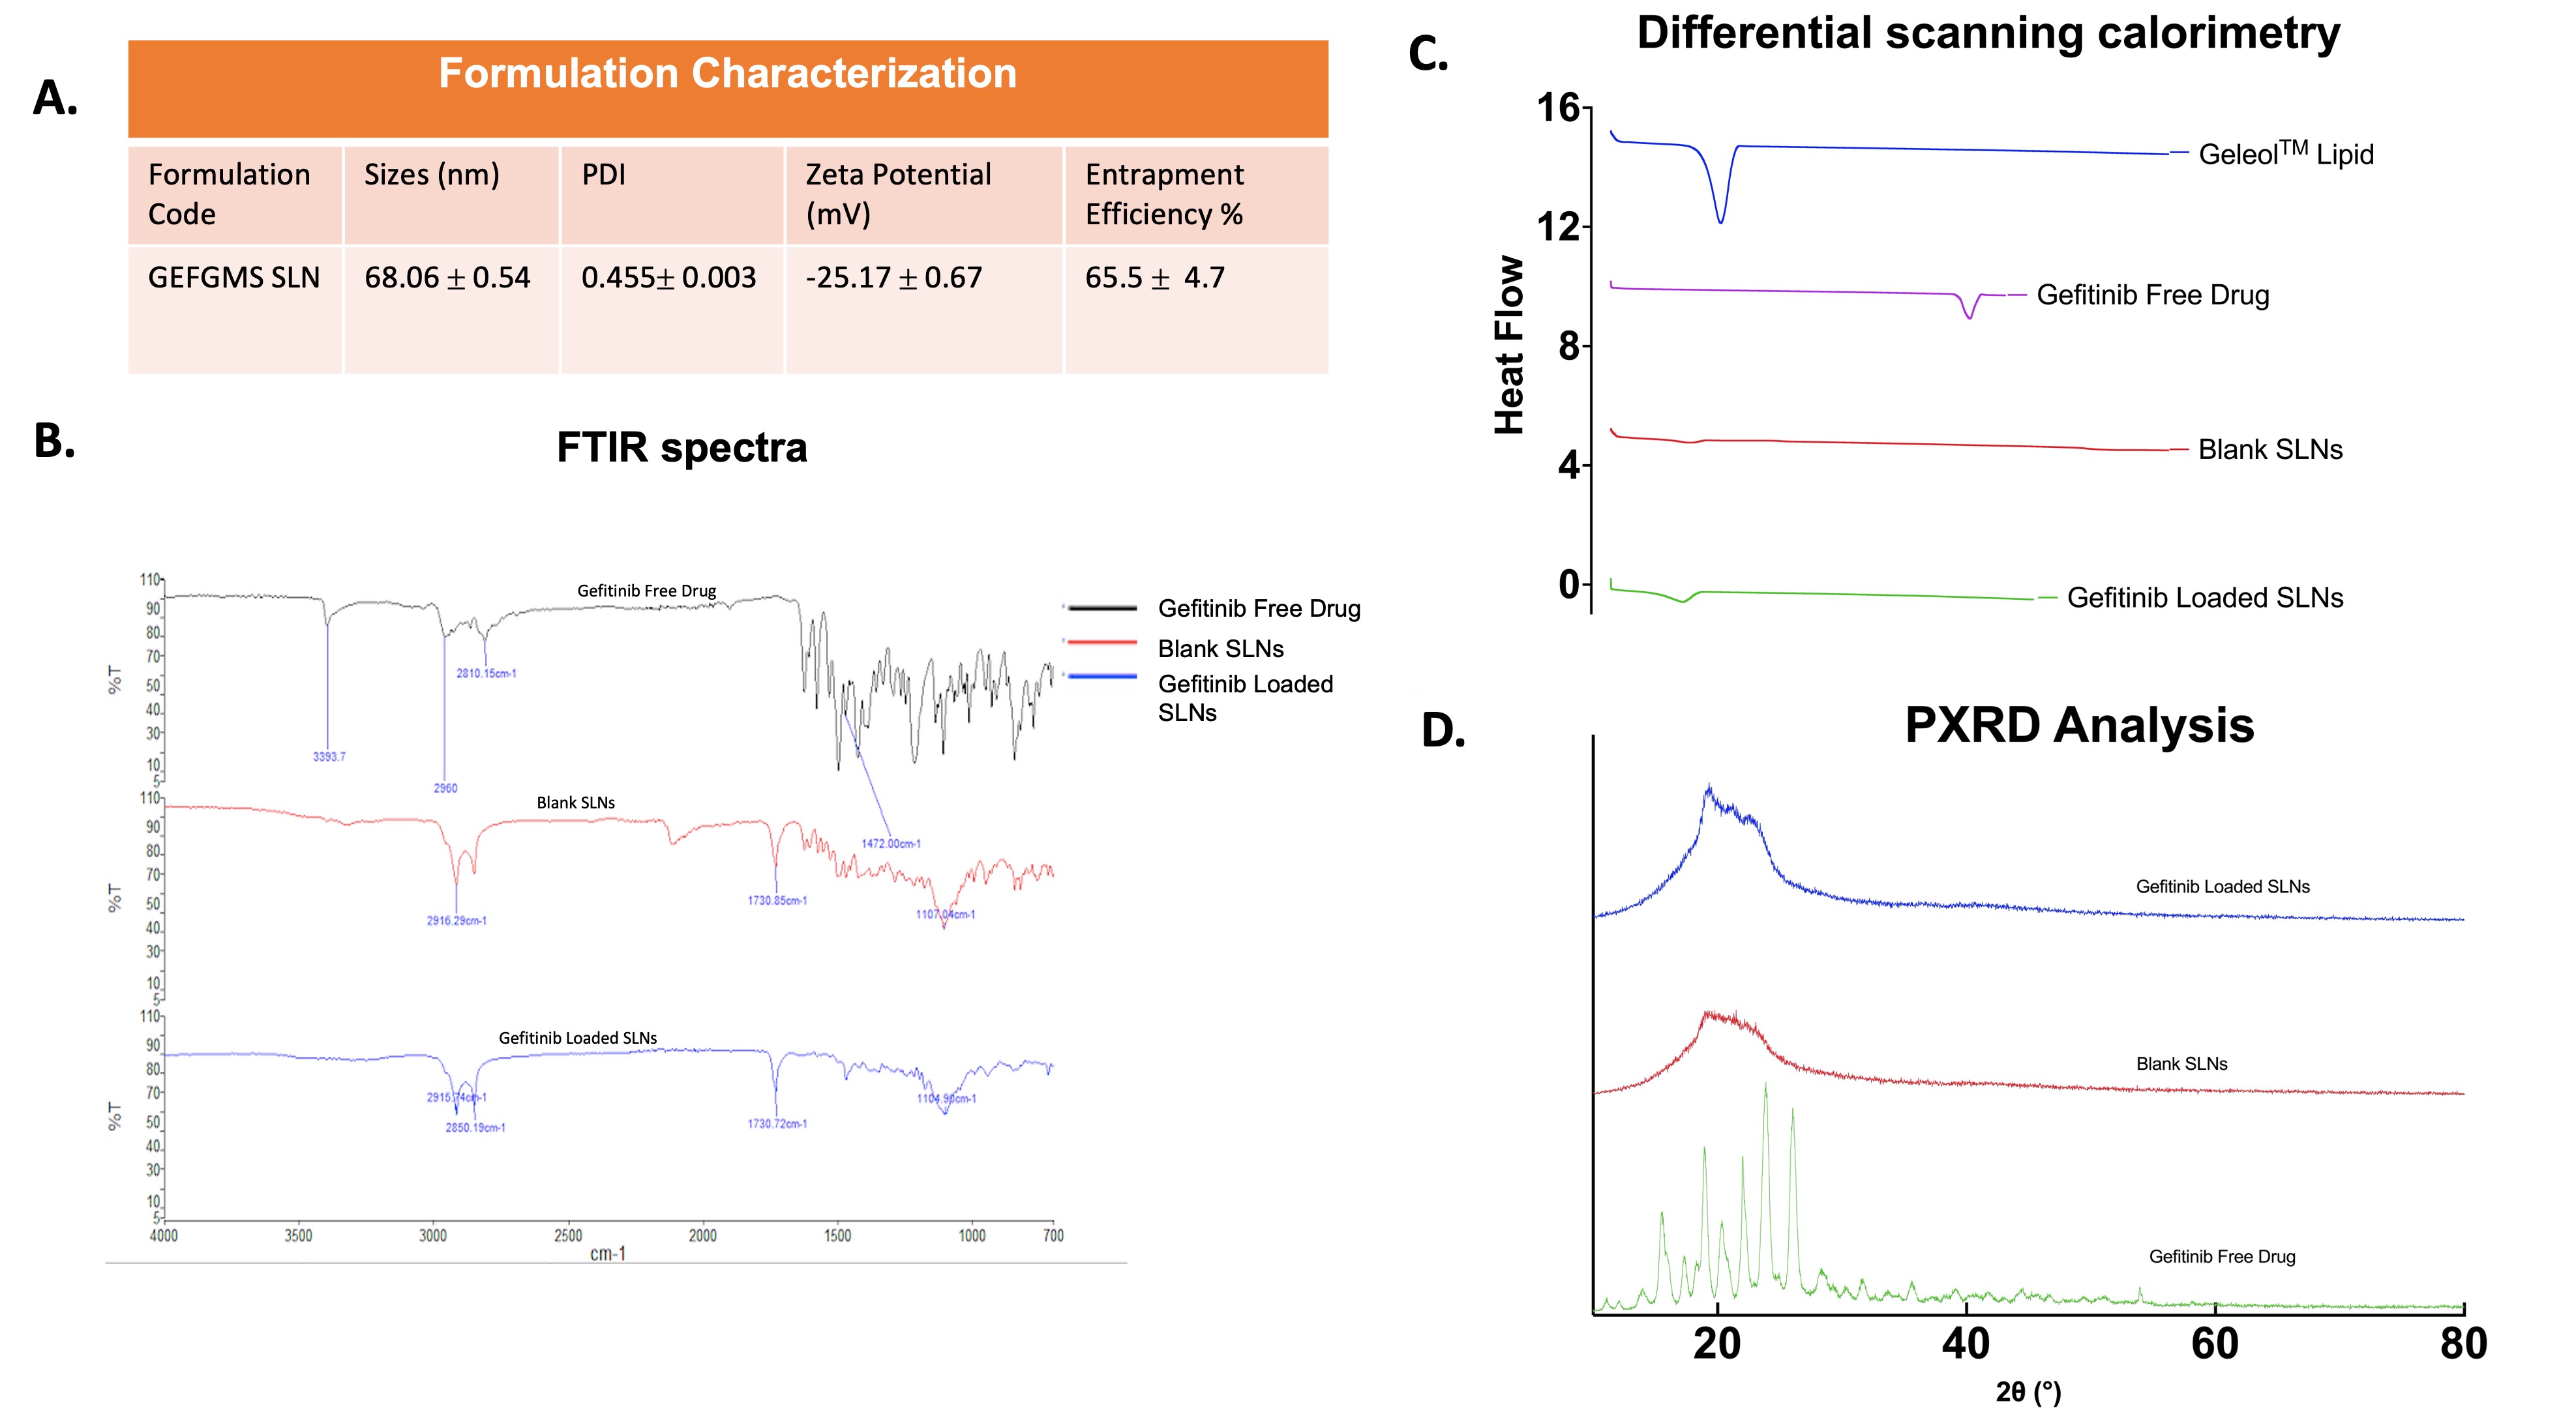 Figure 1: A) Table 1: Particle size, PDI, zeta potential, and entrapment efficiency of gefitinib-loaded SLNs, (n = 3, Mean ± SD), B) FTIR spectra of the free drug, the blank formulation, and the drug loaded formulation, C) Thermograms of the lipid, the free drug, the blank nanoparticles, and the drug loaded nanoparticles, D) X-ray diffractogram of the free drug, the blank formulation, and the drug loaded formulation.
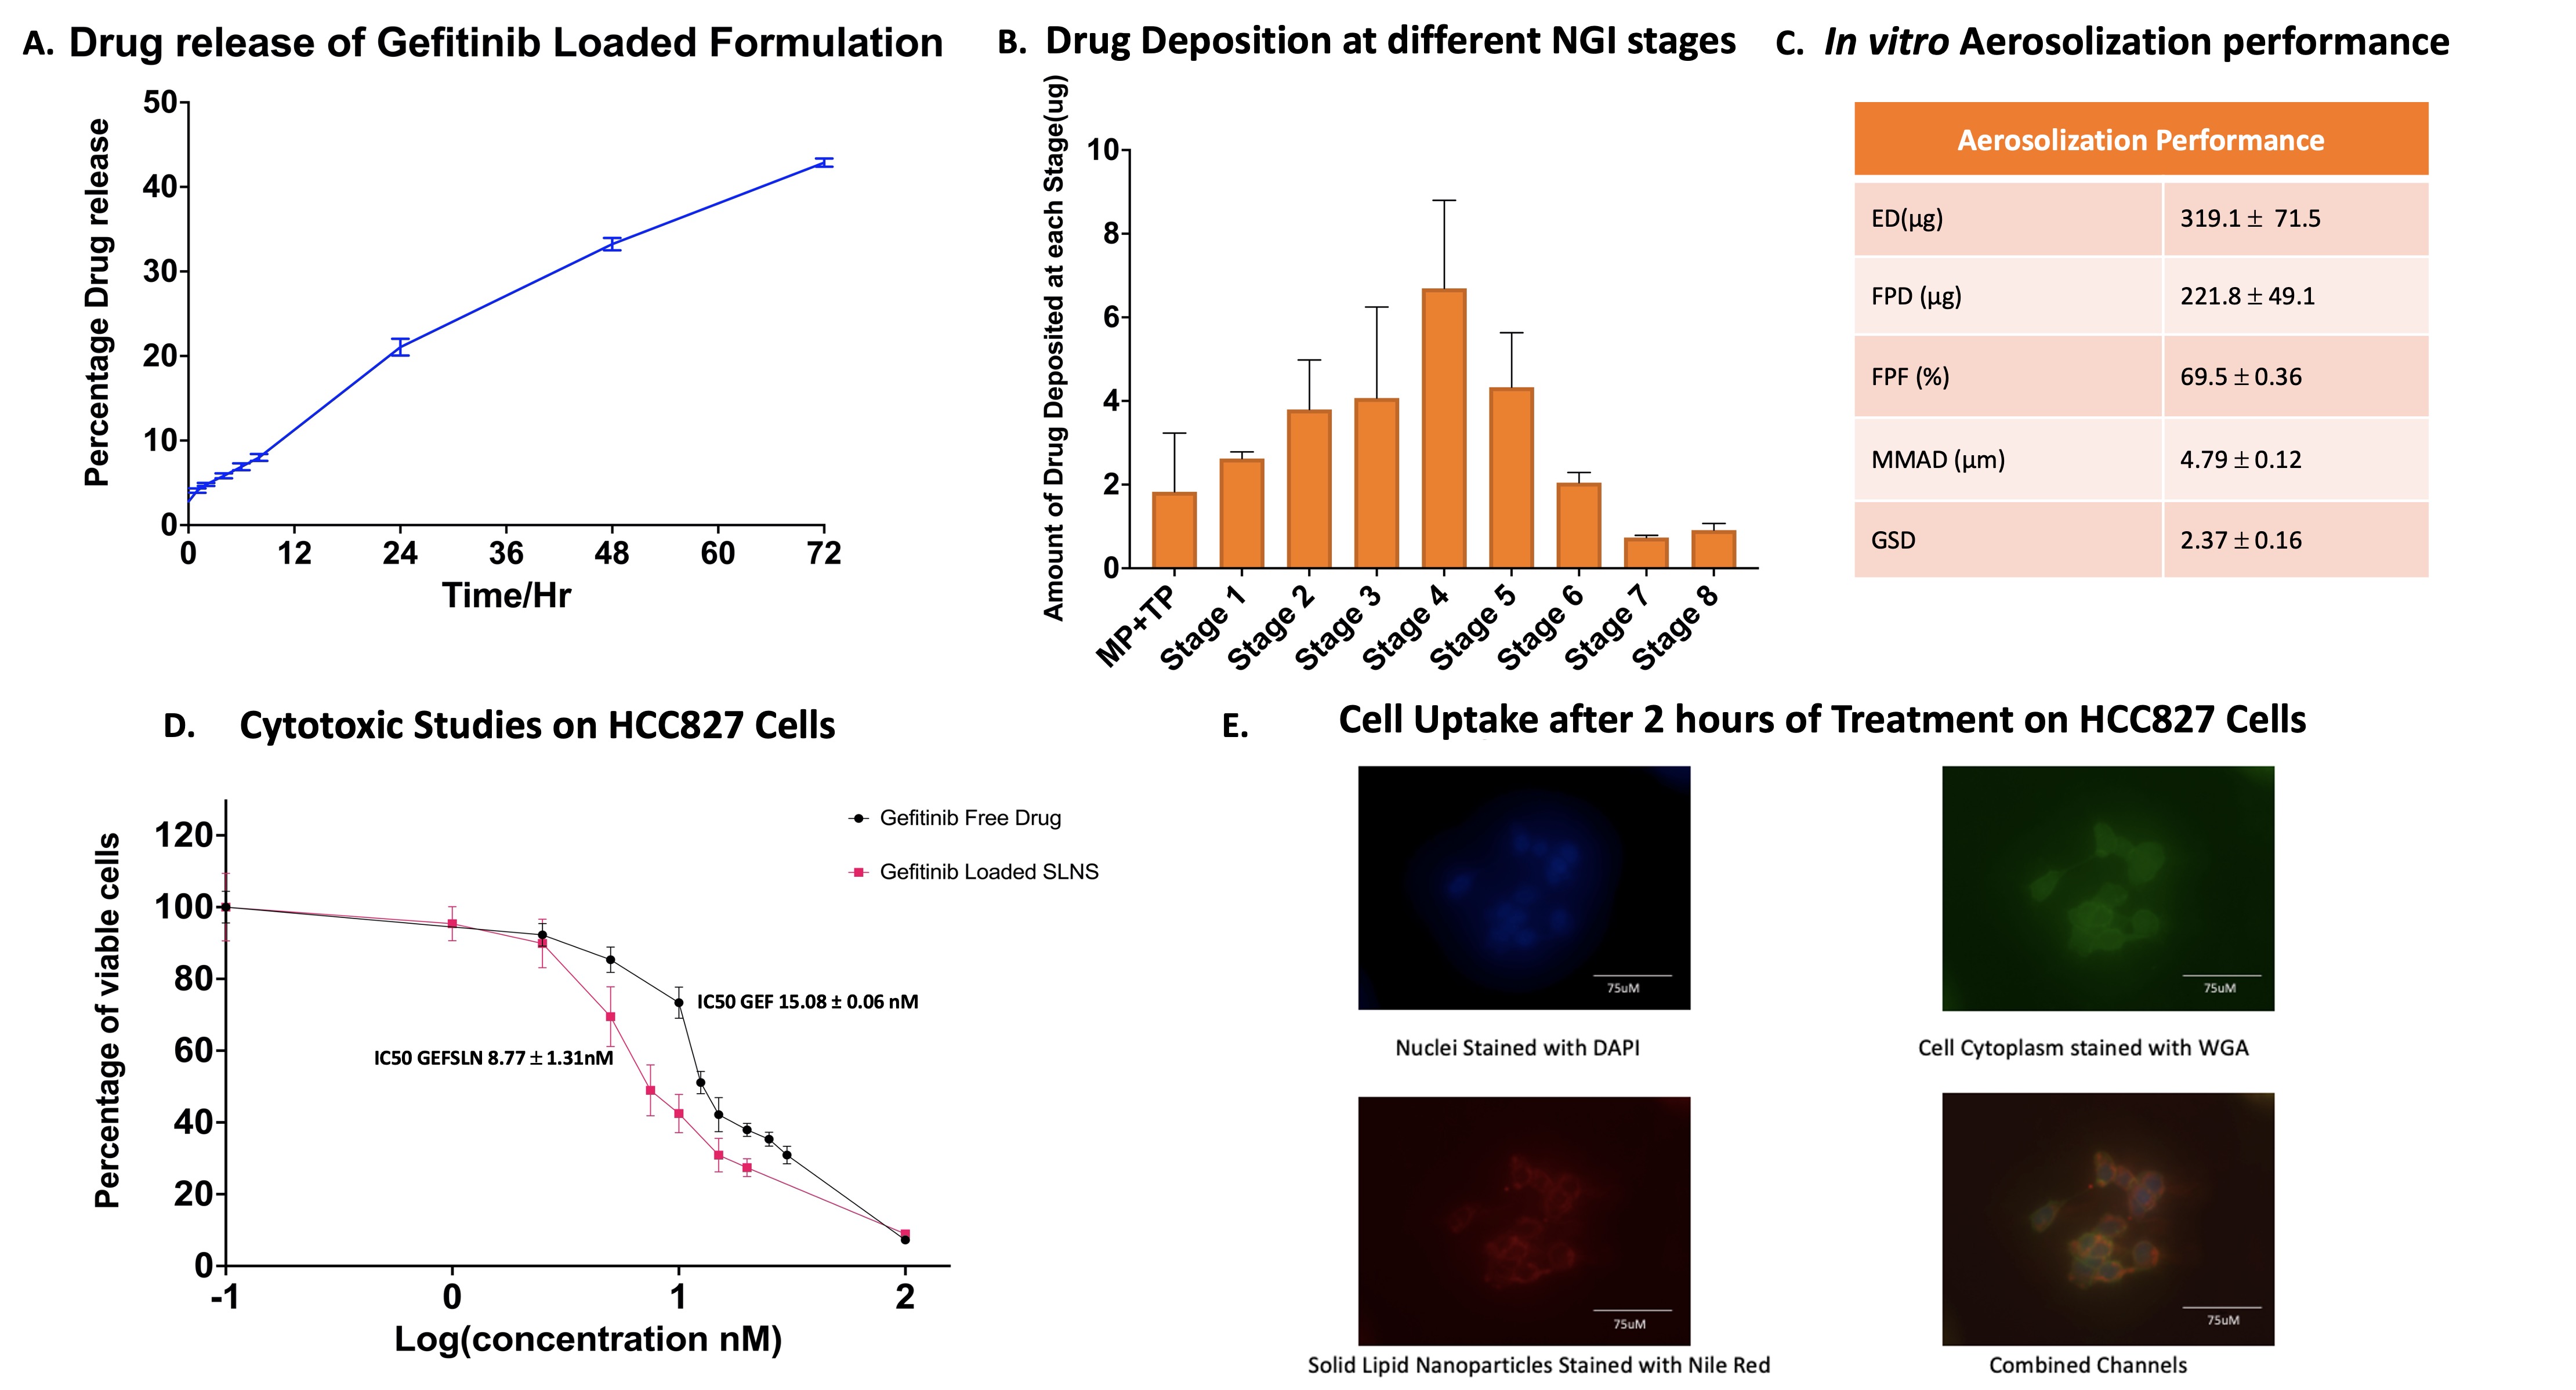 Figure 2: A) Drug release at pH 7.4n PBS, (n = 3, Mean ± SD), B) Chart representing the amount of drug deposited at each stage after nebulization (n = 3, Mean ± SD), C) Aerosolization performance of the nebulized formulation including the emitted dose, fine particle fraction, mass median aerodynamic diameter, and geometric standard deviation, D) Cytotoxic Studies of gefitinib and GEFSLNs on HCC827, (n = 3, Mean ± SD), E) Fluorescent images of the cellular uptake of the formulation loaded with Nile Red in HCC827 with 4′,6-diamidino-2-phenylindole (DAPI) staining the nucleus blue and Wheat germ agglutinin (WGA) staining the cell cytoplasm green.
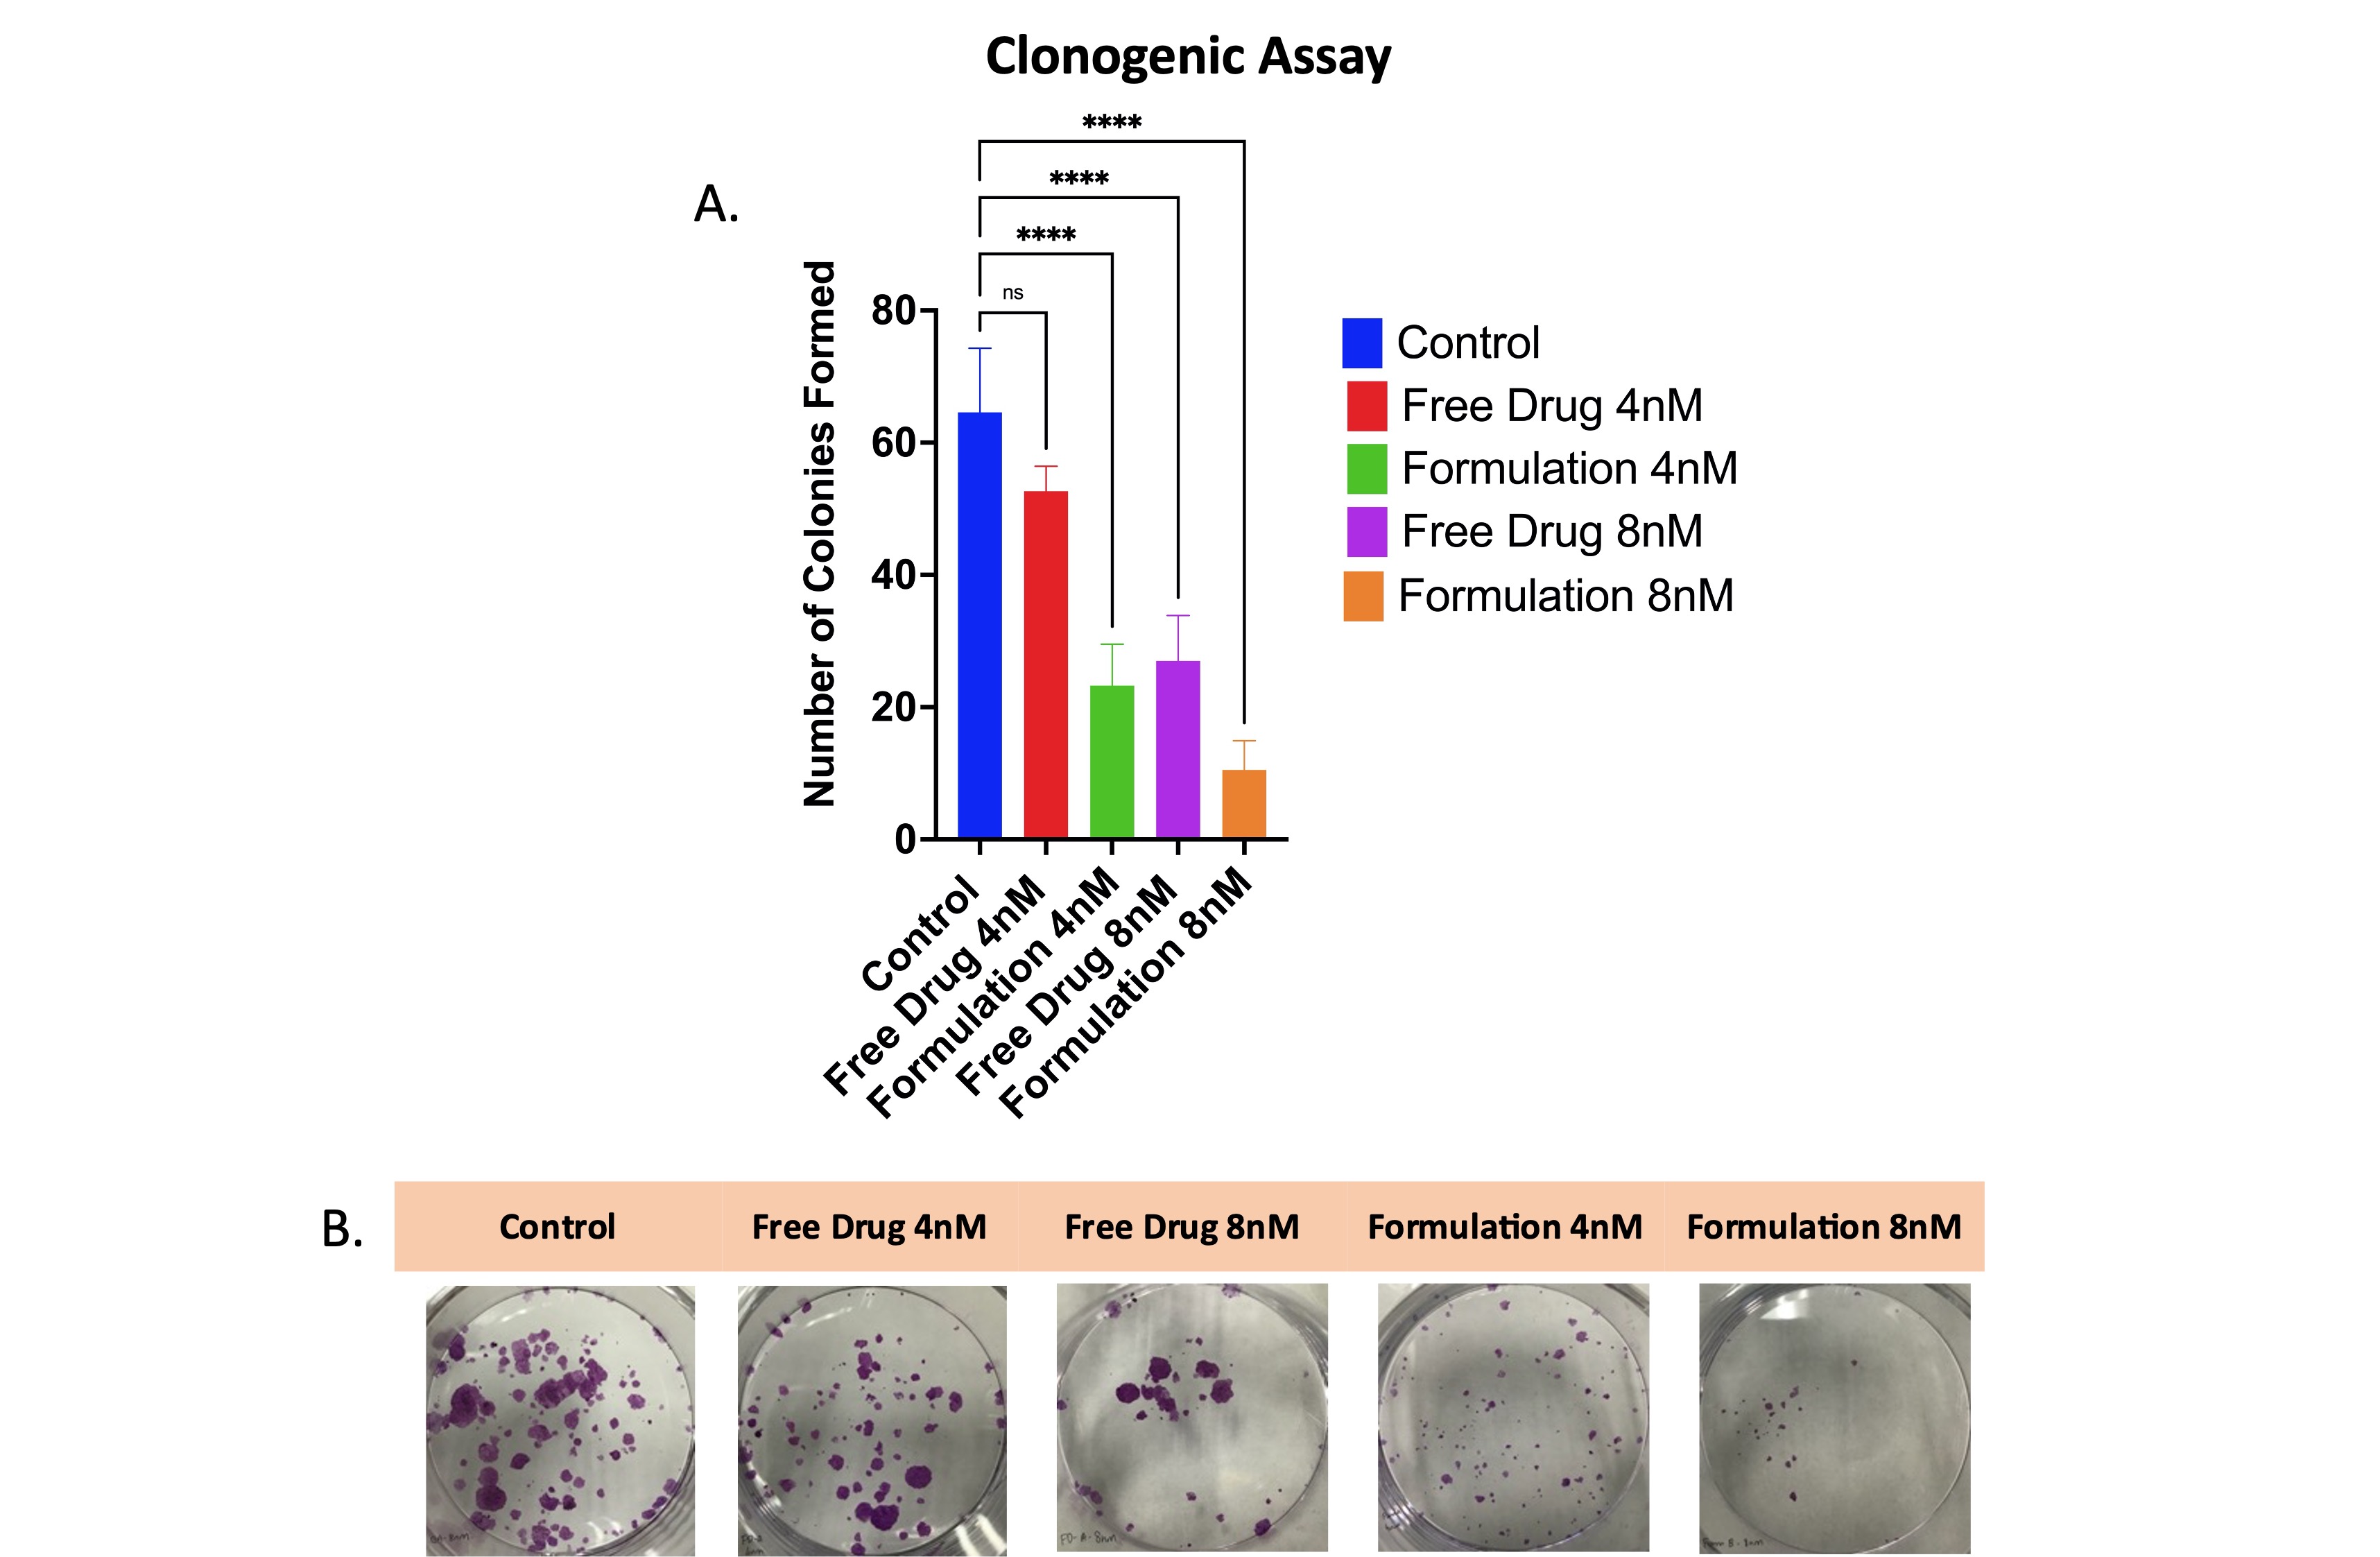 Figure 3: A) Clonogenic assay analysis after 48 h of GEF and GEFSLNs treatment at 4 nM and 8 nM. B) Images of colonies stained with crystal violet post 10 days of incubation in fresh media (n = 4, Mean ± SD). **** p < 0.0001.